The documentation for the check command seems to hint at differences in plot quality.
Is this true? Do some plots contain more potential quality proofs than others? I don’t mean just returning a better ratio when tested through check, but actually a difference in the total amount or the quality of the potential proofs contained.
If so, could someone explain why? what is the underlying basis? Are the proofs less orthogonal to each other? Too many near duplicates etc?
Suppose you have plotted all your disk space, would you consider removing and re-plotting the worst plots with the idea of gradually over time upping the average quality of your farm?
I believe some plots can be corrupted, I’ve never heard of unlucky plots.
At current costs I wouldn’t replot specifically for that, but if I had to replot some drives I would try to diagnose plots to make sure I didn’t have any bad luck plots (if there’s such a thing) : run about 4 or 5 tests on different parts of the plot and for 300 proofs.
I always make sure that all my plots are good after plotting. If I had a full ram plotter, maybe the electricity cost of replotting would be worth it, in the long run on a big farm where the plotters are sitting idle.
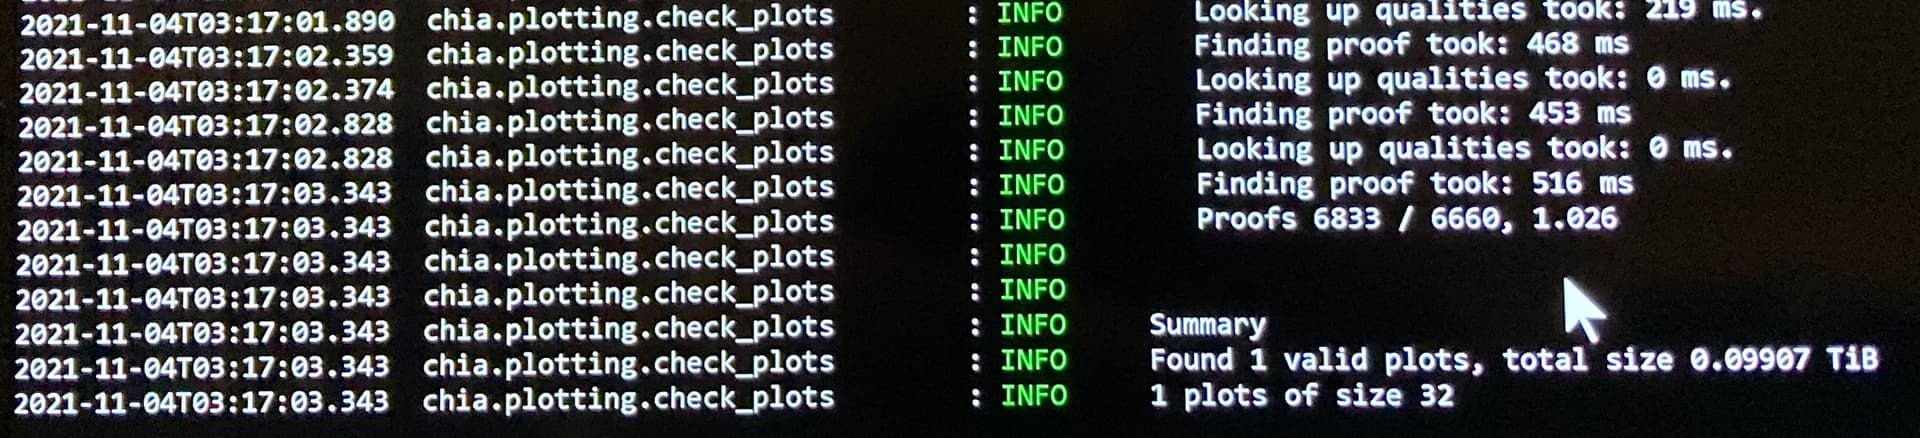
You really believe that plot check of 6000 is really a significant indicator for a plot file that contains at least several million potential proofs? Also having higher than the number of checks means that it found multiple proofs for the same challenges at the set difficulty, this could actually be considered a negative because your plot is less “diversified” and could be seen to contain fewer unique proofs. The entire idea of plot quality being measurable is ridiculous.
Take that with a grain of salt. Also, it looks like you’re running chia plots check, which is slow as dirt because it uses python. If you’re serious about testing plots you should download and build the real chiapos repo which is written in C and is significantly faster.
This is why the answer to the question of “do lucky plots exist?” is NO. When you are checking plots, it is just using a “hard-coded” challenge. So your plots might be “lucky” or “unlucky” for that specific challenge but we don’t know if they will be lucky or unlucky for the real challenges issued by the blockchain. If they are lucky for a specific challenge, great, you win the block! If they are unlucky for that challenge, you don’t win the block.
Checking plots gives you the confidence that your plots will probably also pass real challenges, but it gives you absolutely no indication of if that plot will be “lucky” for any other challenge. Therefore, the question “do lucky plots exist” doesn’t really make sense - of course they do - they are the ones that win the blocks! But also once the block is won, any other plot might be the new “lucky” one.
Yes, I think we are saying the same thing, but differently. The number of proofs per challenge will obviously depend on the challenge. When you check plots with the CLI, the challenge is always the same (unless you use the offset, which I didn’t know about - cool!). Therefore, it wouldn’t make sense to determine “luckiness” from running plot checks. A plot may have a lot of proofs for the test challenge, but none for the “real challenges” over the next month. Does that make sense?