I have an used dell r730 running windows 10. I know it’s not the best system to run it at but I’m not an expert on computers. However, somehow I have extremely slow plotting speed (24+ hours per plot).
The system spec is:
2* Intel Xeon E5-2682 v4 with 16 core 32 threads each
192GB ddr4 memory at 2400 mhz
5*2TB NVMe SSD
18 * 2.5 inch Hitachi enterprise-grade SSD 400G
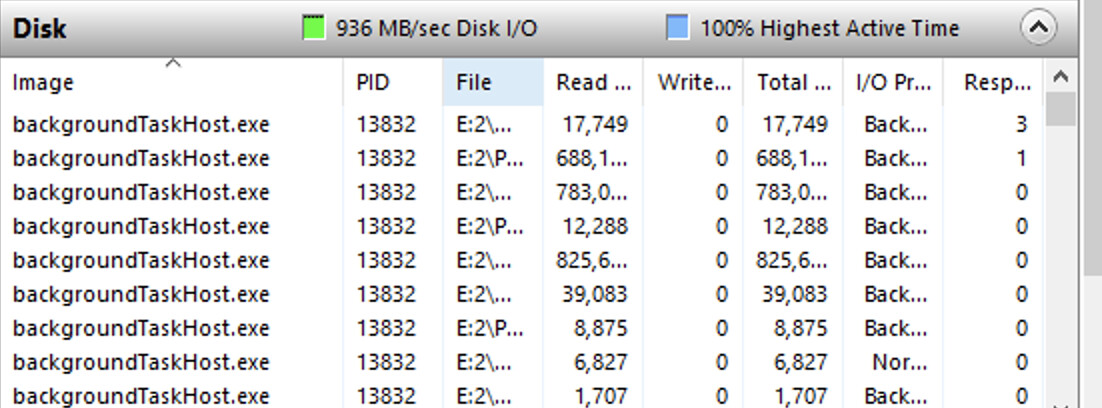
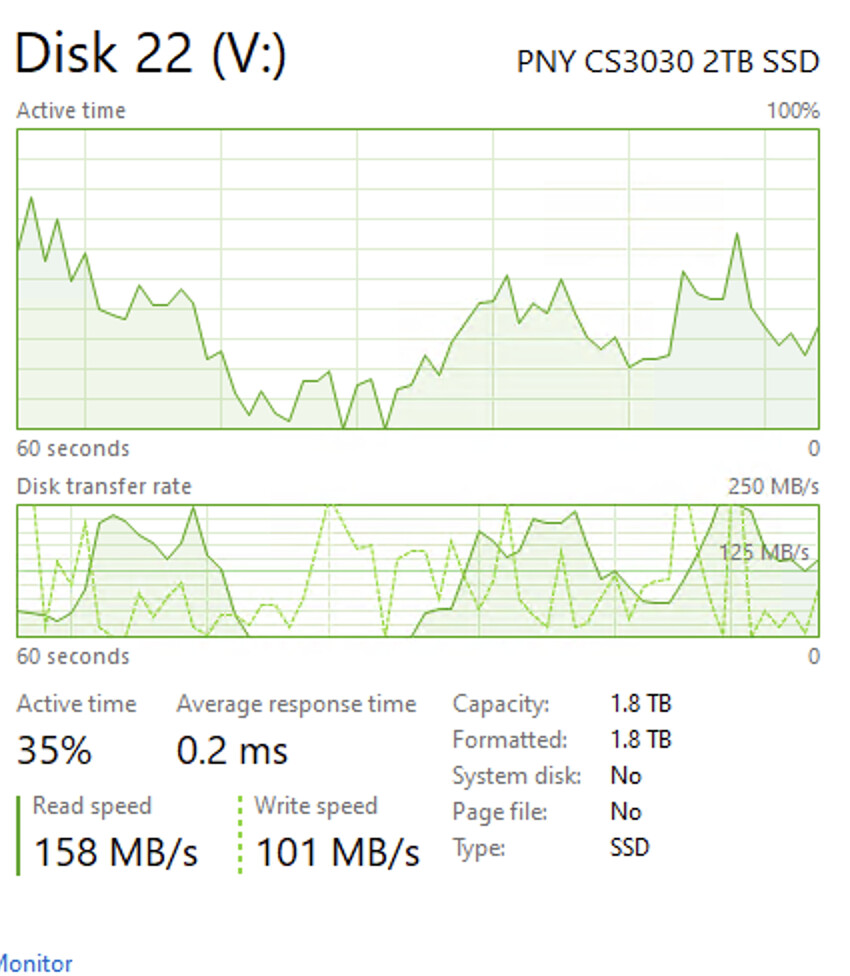
I’m running 53 plots in parallel, 7 for each NVMe SSD and 1 for each 2.5-inch SSD. Somehow I’m only using 25% CPU with 53 threads running and memory is not even used by half. None of the SSD’s is working at over 20% max active time. Plot time is super slow, here are some truncated logs to meed maximum character limit:
        Total matches: 4294019472
Forward propagation table time: 5374.283 seconds. CPU (86.310%) Sat May 15 20:04:23 2021
Computing table 6
        Total matches: 4293083166
Forward propagation table time: 5014.210 seconds. CPU (87.180%) Sat May 15 21:27:57 2021
Computing table 7
        Total matches: 4291183841
Forward propagation table time: 4182.972 seconds. CPU (84.020%) Sat May 15 22:37:40 2021
Time for phase 1 = 28687.323 seconds. CPU (85.670%) Sat May 15 22:37:40 2021

Starting phase 2/4: Backpropagation into tmp files... Sat May 15 22:37:40 2021
Backpropagating on table 7
scanned table 7
scanned time =  189.784 seconds. CPU (23.990%) Sat May 15 22:40:50 2021
sorting table 7
Backpropagating on table 6
scanned table 6
scanned time =  495.446 seconds. CPU (50.560%) Sat May 15 23:10:30 2021
sorting table 6
sort time =  1918.428 seconds. CPU (50.790%) Sat May 15 23:42:29 2021
Backpropagating on table 5
scanned table 5
scanned time =  388.944 seconds. CPU (67.560%) Sat May 15 23:48:58 2021
sorting table 5
sort time =  1805.172 seconds. CPU (53.290%) Sun May 16 00:19:04 2021
Backpropagating on table 4
scanned table 4
scanned time =  358.749 seconds. CPU (71.150%) Sun May 16 00:25:03 2021
sorting table 4
sort time =  1730.475 seconds. CPU (57.830%) Sun May 16 00:53:53 2021
Backpropagating on table 3
scanned table 3
scanned time =  409.908 seconds. CPU (68.220%) Sun May 16 01:00:44 2021
sorting table 3
sort time =  1729.170 seconds. CPU (57.220%) Sun May 16 01:29:33 2021
Backpropagating on table 2
scanned table 2
scanned time =  354.484 seconds. CPU (72.800%) Sun May 16 01:35:28 2021
sorting table 2
sort time =  1789.136 seconds. CPU (54.170%) Sun May 16 02:05:17 2021
table 1 new size: 3425077190
Time for phase 2 = 12457.976 seconds. CPU (52.030%) Sun May 16 02:05:18 2021
Wrote: 268

Starting phase 3/4: Compression from tmp files into "P:\\plot-k32-2021-05-15-14-39-32d8e08543b5b5d9f2b39dd8ed1cd14dfcfefc01d39930dc66ff51701334dbba.plot.2.tmp" ... Sun May 16 02:05:18 2021
Compressing tables 1 and 2
        First computation pass time: 2558.419 seconds. CPU (48.680%) Sun May 16 02:47:56 20
        Bucket 127 QS. Ram: 3.250GiB, u_sort min: 0.750GiB, qs min: 0.299GiB. force_qs: 1
        Second computation pass time: 2588.184 seconds. CPU (33.030%) Sun May 16 03:31:09 2021
        Wrote 3429259257 entries
Total compress table time: 5151.383 seconds. CPU (40.780%) Sun May 16 03:31:09 2021
Compressing tables 2 and 3
        First computation pass time: 2947.194 seconds. CPU (54.810%) Sun May 16 04:20:17 2021
        Second computation pass time: 2550.675 seconds. CPU (33.970%) Sun May 16 05:02:50 2021
        Wrote 3439526786 entries
Total compress table time: 5500.312 seconds. CPU (45.120%) Sun May 16 05:02:50 2021
Compressing tables 3 and 4
        First computation pass time: 3039.672 seconds. CPU (52.830%) Sun May 16 05:53:29 2021

        Second computation pass time: 2336.739 seconds. CPU (37.310%) Sun May 16 06:32:26 2021
        Wrote 3465447643 entries
Total compress table time: 5376.510 seconds. CPU (46.080%) Sun May 16 06:32:26 2021
Compressing tables 4 and 5

        First computation pass time: 3039.769 seconds. CPU (54.010%) Sun May 16 07:23:06 2021

        Second computation pass time: 2516.554 seconds. CPU (34.710%) Sun May 16 08:05:03 2021
        Wrote 3531782205 entries
Total compress table time: 5556.468 seconds. CPU (45.270%) Sun May 16 08:05:03 2021
Compressing tables 5 and 6
        First computation pass time: 3108.784 seconds. CPU (54.450%) Sun May 16 08:56:51 2021

        Second computation pass time: 2814.072 seconds. CPU (32.900%) Sun May 16 09:43:46 2021
        Wrote 3711556535 entries
Total compress table time: 5922.918 seconds. CPU (44.210%) Sun May 16 09:43:46 2021
Compressing tables 6 and 7

        First computation pass time: 2626.515 seconds. CPU (41.670%) Sun May 16 10:27:32 2021

Total compress table time: 6194.684 seconds. CPU (34.780%) Sun May 16 11:27:00 2021
Time for phase 3 = 33702.374 seconds. CPU (42.580%) Sun May 16 11:27:00 2021

Starting phase 4/4: Write Checkpoint tables into "P:\\plot-k32-2021-05-15-14-39-32d8e08543b5b5d9f2b39dd8ed1cd14dfcfefc01d39930dc66ff51701334dbba.plot.2.tmp" ... Sun May 16 11:27:00 2021
        Starting to write C1 and C3 tables
        Finished writing C1 and C3 tables
        Writing C2 table
        Finished writing C2 table
        Final table pointers:
        P1: 0x10c
        P2: 0x37477dc56
        P3: 0x6b5d44ebb
        P4: 0x9fd7890d5
        P5: 0xd552f4e8d
        P6: 0x10d874b0b9
        P7: 0x14e82a1126
        C1: 0x19073bfa26
        C2: 0x1907562b26
        C3: 0x1907562bd6
Time for phase 4 = 3765.667 seconds. CPU (30.910%) Sun May 16 12:29:46 2021
Approximate working space used (without final file): 269.266 GiB
Final File size: 101.314 GiB
Total time = 78613.363 seconds. CPU (59.240%) Sun May 16 12:29:46 2021
Copied final file from "P:\\plot-k32-2021-05-15-14-39-32d8e08543b5b5d9f2b39dd8ed1cd14dfcfefc01d39930dc66ff51701334dbba.plot.2.tmp" to "Z:\\plot-k32-2021-05-15-14-39-32d8e08543b5b5d9f2b39dd8ed1cd14dfcfefc01d39930dc66ff51701334dbba.plot.2.tmp"
Copy time = 822.298 seconds. CPU (20.020%) Sun May 16 12:43:28 2021
Removed temp2 file "P:\\plot-k32-2021-05-15-14-39-32d8e08543b5b5d9f2b39dd8ed1cd14dfcfefc01d39930dc66ff51701334dbba.plot.2.tmp"? 1
Renamed final file from "Z:\\plot-k32-2021-05-15-14-39-32d8e08543b5b5d9f2b39dd8ed1cd14dfcfefc01d39930dc66ff51701334dbba.plot.2.tmp" to "Z:\\plot-k32-2021-05-15-14-39-32d8e08543b5b5d9f2b39dd8ed1cd14dfcfefc01d39930dc66ff51701334dbba.plot"
2021-05-16T12:43:41.634  chia.plotting.create_plots       : INFO     Memo: 8187a83d420b70d318ebb5296d8e7ca96a6e39cb43bfc01c9b9f77c9c4a98dc645c87e567bfc556169c9f265ef16ff03aa355a6e9a135465fa169a55960fff2584fb42ce6c882c5060ab1805fe314227832aa811a4c79f5f70d401a42f2b69b26ed7352007ed27db70533eb891c665ef4b9da26d18eaec1c2f126a0757e18125