Farmer: I5-11400, 500GB Samsung 860 Evo SATA ssd, 64GB DDR4 memory.
I did debug.log file analysis to highlight response time improvements between v1.2.11 > v1.3.1 (including db upgrade). These graphs cover some 44,331 discrete response log entries. Being a visual person, I appreciate and internalize seeing changes with graphs rather than just looking at raw numbers.
As an aside, has anyone else noted that the default debug.log file has grown from its maximum of 20,481 KB to 51,201 KB, before it is retired and a new file is created?
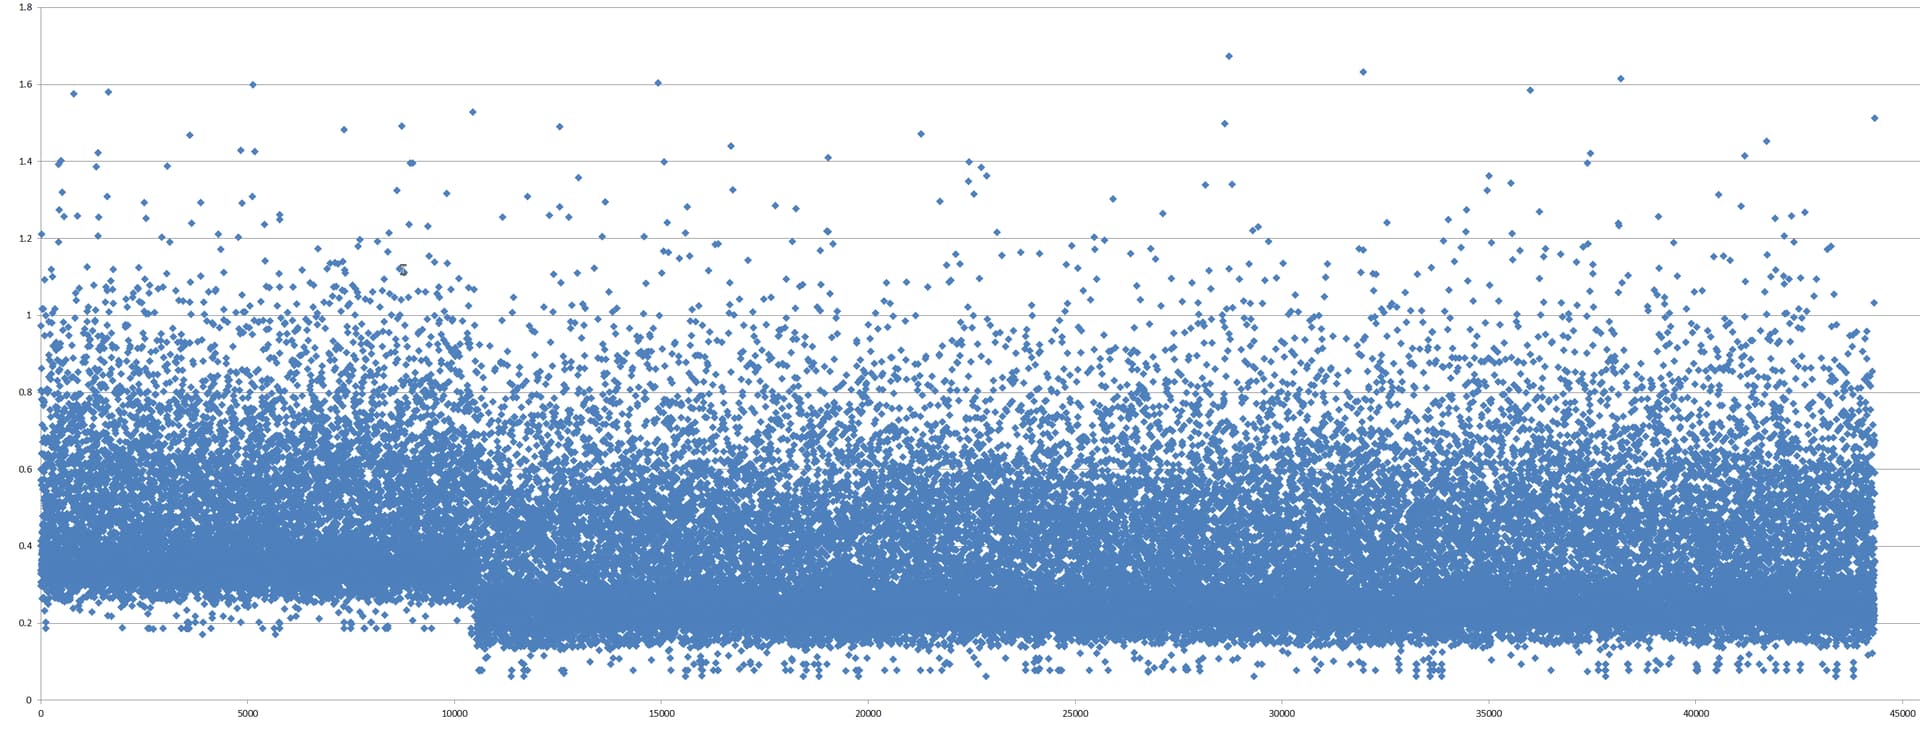
First up, I captured the overall improvement in farmer response. The step down is where I upgraded from 1.2.11 to 1.3.1 and the db. The decrease was immediate, and significant.
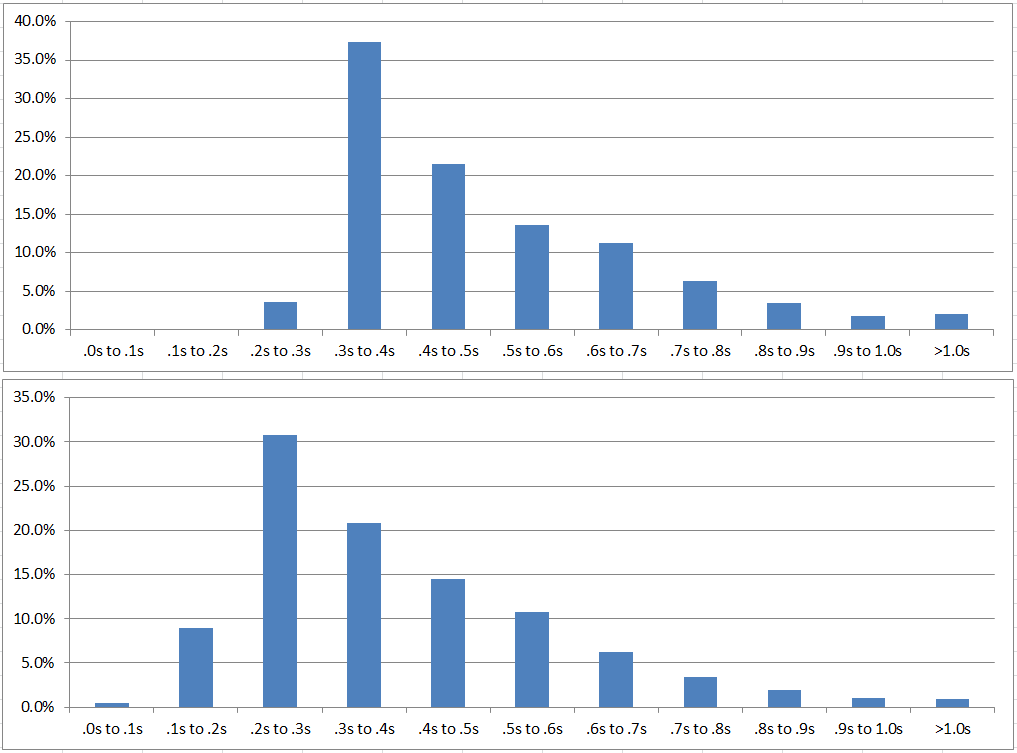
Second, to see discrete time improvements, I did a graph of response distribution before and after upgrade. Minimum times decreased greatly from .2s-.3s to .0s-.1s! … Even more significant, whereas ~35% of times were between .3s-.4s, now ~30% have shifted to between .2s-.3s.
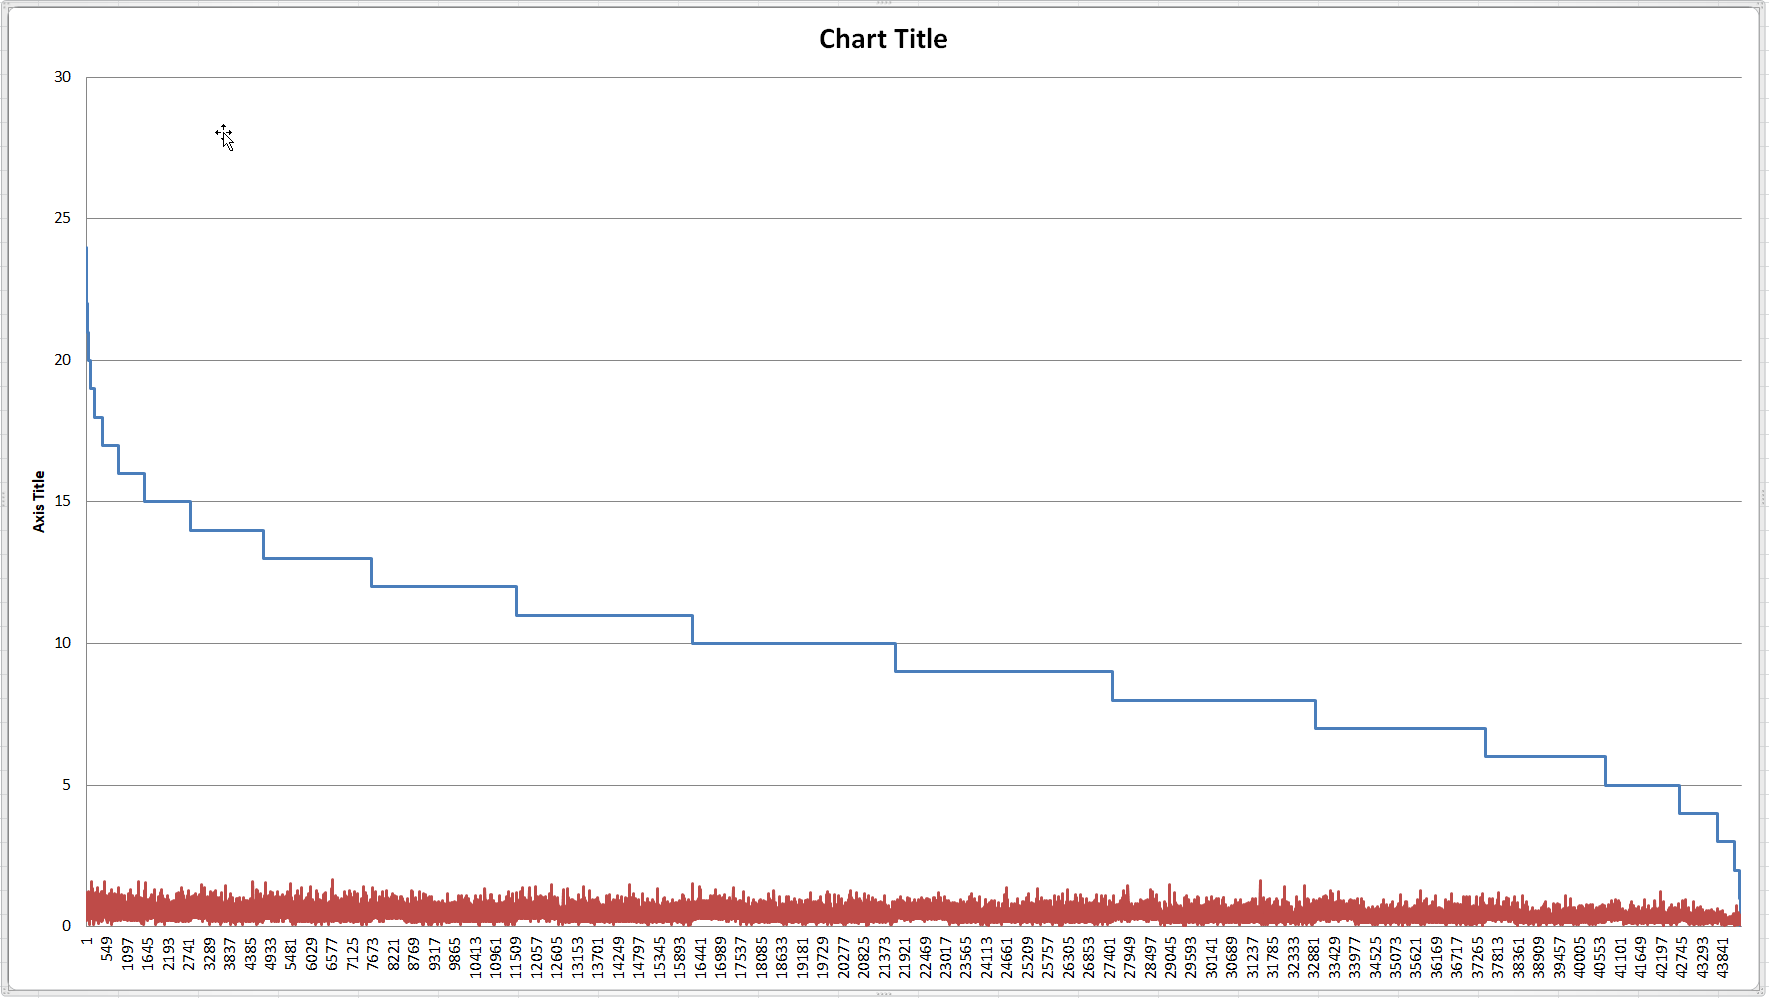
Third, I wondered how the number of plots passing the filter (at the same time) affected response, if at all. This graph shows that there is only a minor increase in times vs. number of plots passing the filter.
Everyone’s timings will vary depending on their setup, but this upgrade should make overall improvements to all. My ‘always’ goal was to have farmer response under one second. Anyone on the fence about the upgrade, should consider these improvements and do the upgrade as soon a possible. Kudos to the Chia dev team!
Perhaps someone with a Pi can do something similar to show how (if) their responses have changed? improved? I would guess they had, as the overall db performance has improved. That should apply to all.
Another observation is the more RAM you have available, the more will be used by OS page cache, and it will improve lookup times (Windows 10).
I tried TrueNAS briefly and while ZFS theoretically has a better caching algorithm and more configuration options, the storage overhead of ~5% was a deal-breaker for me.
The improvements needed for all (not just RPis) are around start_full_node process dispatching part. I am finishing a full sync of v2 db from scratch, and I cannot say that I see any improvements comparing to v1 sync (either on v1.2.11 or v1.3.1 - same thing). As before, start_full_node chokes a single core it sits on, and all other block crunching cores are basically starving (i9-10900 - 10 phys cores). Disk (WD Black SN750 - 3,430 MBps) is running at 10-20% write load, although only at ~100MBps due to small write chunks (read is mostly zero; so, it has plenty of headroom). The network part averages around 2 Mbps (say you have 80 peers, but only 40 are fully sync (on this box, all but two are fully synced), you should be able to easily pull 40 Mbps).
The problem is not really RPis, but rather bad start_full_node code that cannot scale with the CPU, and bad code that doesn’t adjust network side depending on the load / connected nodes to not let full node be saturated with garbage requests during dust storms. Sure, there are some RPi installations that still run from SD cards, and there is no excuse for that. However, the low performing boxes is just a boogeyman used to deflect from the real issue.