Harvester not working

I’m running a full node on a Raspberry Pi (Yes I know.) The wallet and DB are located on an external NVME USB drive… so, it’s not as bad as running on the internal disk.

OS is Ubuntu 64 21.10 with latest patches.
Python is 3.9.
Chia version is 1.2.11 (current as of time of this post).

A bit of background…

I initially was running a full node and plotting on a server-class dual cpu machine. That was working out great, but was chewing a LOT of electricity when it was idly farming. I was also running ChiaDog to keep me informed when something went sideways.

So, I decided to keep the big machine for plotting only and got a RPi 4B 8GB model with a high speed 256GB SDHC.

Connected to this are my drives directly into the four USB ports. (Yes, I’m still very small right now with only three large farming drives and one DB/Wallet drive).

So when I moved the config from the big machine to the RPi - everything seemed to go well. I set up the drives (Formatted NTFS and 1024k block sizes) in Ubuntu. Installed Chia. Copied over my .chia folder completely. Edited the config.yaml for chia to point to the new mount points for the plots.

Started it up and it ran fine - for weeks. Then it stopped. I started getting alerts from Chiadog that the harvester wasn’t running. I was getting alerts from my pool that my harvesters weren’t running. Something was amiss.

Long story-short, I’ve reinstalled chia and chiadog. Re-initialized my chia instance from scratch and re sync’d the entire blockchain db.

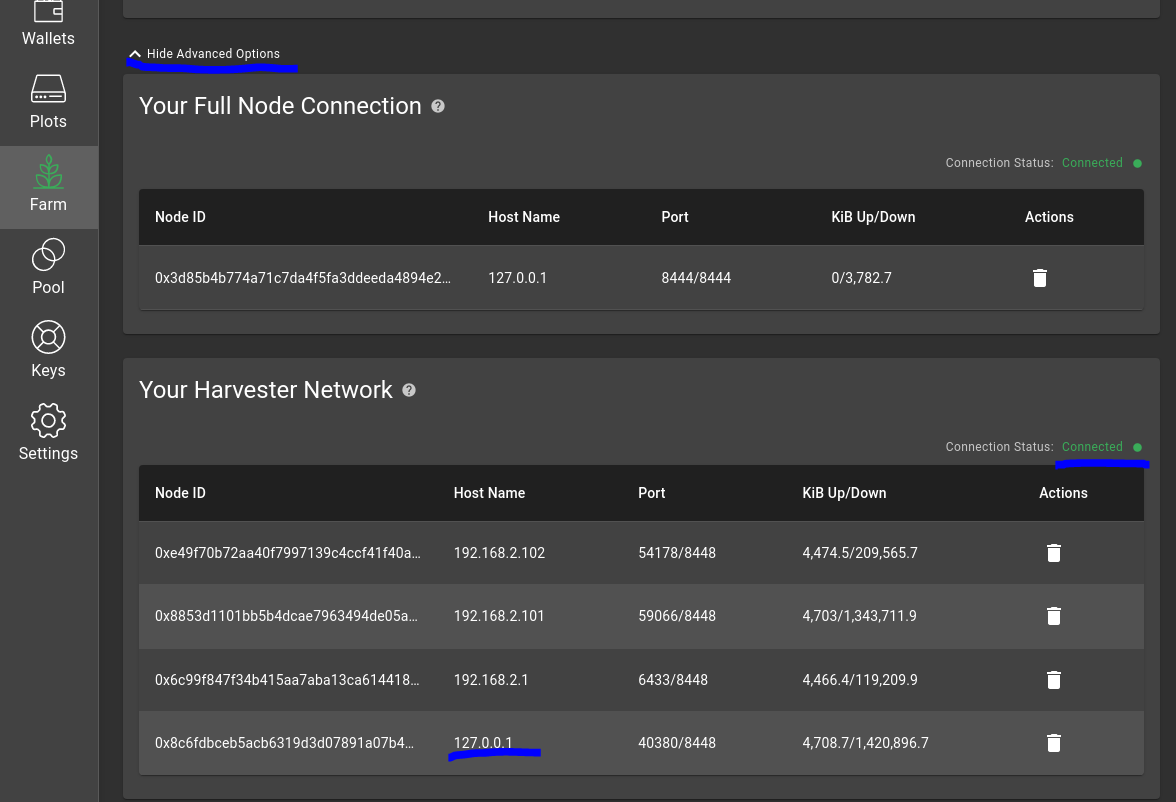
For some reason I can’t figure out, the harvesters won’t work!
Chiadog keeps reporting that the harvester isn’t doing anything.
My pool keeps reporting that I’m not farming.
I did a chia plot check and everything looks good. All of my plots are there and look okay from what I can tell.

I’ve rebooted several times. Reinstalled Chia.

My router has a port forward to the appropriate IP. The IP of the Raspberry Pi hasn’t changed. I see incoming connections from other computers… I’m at the limit of what I know to look for next…

Any thoughts on what to look for next?

I assume, that your node is synced.

  1. How much memory your RPi has?
  2. Where is your swap file, how big?
  3. When you do “grep ERROR debug.log | grep harvester” what do you get?
  4. If nothing in #3, just grep on harvester only, do you see something like:
    4.1. “plots were eligible for farming”
    4.2. “refresh_batch: event batch_processed, loaded”
  5. Run "grep ERROR debug.log, any errors there?
1 Like

Rpi has 8gb of Ram.
Swap file is 1024MB and is located on the internal SDHC card.

Did #3 - nothing.
#4 returned this:
2022-01-03T18:00:07.089 harvester chia.harvester.harvester: WARNING Looking up qualities on /media/chadmin/CH2/chiafinal/plot-k32-2021-11-01-08-24-6368316119368ef1e662c05848e379a735890ab013b03af1a2fdd9587a0cd0c4.plot took: 7.588778495788574. This should be below 5 seconds to minimize risk of losing rewards.
2022-01-03T18:00:09.570 harvester chia.harvester.harvester: WARNING Looking up qualities on /media/chadmin/CH1/chiafinal/plot-k32-2021-07-13-10-38-7c67fccd0f18916734f8c0e287663729162ec1111883bbdf2cc3f331f294d800.plot took: 8.395339965820312. This should be below 5 seconds to minimize risk of losing rewards.

Looks like two instances of slow response, so it looks like it’s at least running.

#4.1:
Nothing (That’s bad, right?)

#4.2:
Nothing

#5:
(venv) chadmin@chadmin-desktop:~/.chia/mainnet/log$ grep ERROR debug.log
2022-01-03T18:12:56.776 full_node full_node_server : ERROR Exception: [Errno 110] Connection timed out with 223.214.154.220
2022-01-03T18:12:56.778 full_node full_node_server : ERROR Exception Stack: Traceback (most recent call last):2022-01-03T19:11:02.457 full_node full_node_server : ERROR Exception: [Errno 110] Connection timed out with 84.10.157.125
2022-01-03T19:11:02.458 full_node full_node_server : ERROR Exception Stack: Traceback (most recent call last):

Don’t know if it matters, but here’s the swap file info…

(venv) chadmin@chadmin-desktop:~/.chia/mainnet/log$ swapon --show
NAME TYPE SIZE USED PRIO
/swapfile file 1024M 1024M -2

In the GUI’s Farm section all the way down are advanced options, normally hidden.
Click show advanced options and you get something like this (below).
In your case only Harvester will be at 127.0.0.1 if you have no remote harvesters.
Does it show connected?

1 Like

Yes, node is fully sync’d…

chia show -s -c chadmin-desktop: Mon Jan 3 19:00:02 2022
Current Blockchain Status: Full Node Synced

Peak: Hash: 35ee88a278d26a18b498967a1ffd1aa636ff4343d36c27480668ec7b2bc8807f
Time: Mon Jan 03 2022 18:59:20 EST Height: 1372555

Do you know the command line version of that? Is it chia show -c?

I don’t see anything for Harvester…
Here’s the output…
chia show -c
Connections:
Type IP Ports NodeID Last Connect MiB Up|Dwn
WALLET 127.0.0.1 35864/8449 64a0e011… Jan 03 20:43:31 155.9|0.0
FARMER 127.0.0.1 35866/8447 2de467da… Jan 03 17:28:21 0.1|0.0
FULL_NODE 2003:c1:e70f:3400:31d6:f845:432f:c7b8 51335/8444 47c96b25… Jan 03 20:47:13 2.3|1.9
-SB Height: 1372900 -Hash: 1ab2334e…
FULL_NODE 123.123.42.8 51633/8444 99e31692… Jan 03 20:47:13 1.3|0.9
-SB Height: 1372899 -Hash: f33b643b…
FULL_NODE 240e:398:4caa:5180:8ede:f9ff:fe8b:3bc1 51489/8444 78f7f389… Jan 03 20:47:13 1.4|1.1
-SB Height: 1372899 -Hash: f33b643b…
FULL_NODE 125.68.5.196 24704/8444 c25e9d3a… Jan 03 20:47:13 2.1|1.0
-SB Height: 1372900 -Hash: 1ab2334e…
FULL_NODE 80.60.70.160 8444/8444 aff4dff3… Jan 03 20:47:13 1.2|4.4
-SB Height: 1372900 -Hash: 1ab2334e…
FULL_NODE 194.44.17.247 53033/8444 a603638f… Jan 03 20:47:13 1.2|1.5
-SB Height: 1372899 -Hash: f33b643b…
FULL_NODE 203.217.117.185 8444/8444 3cb403c3… Jan 03 20:47:13 1.2|0.9
-SB Height: 1372900 -Hash: 1ab2334e…
FULL_NODE 2408:8207:544e:f190:89b6:7002:af42:c8e5 59670/8444 bb6c38f4… Jan 03 20:47:13 1.1|1.0
-SB Height: 1372900 -Hash: 1ab2334e…
FULL_NODE 2001:b011:b:3bfe:3bdb:8276:aa94:a6e5 47862/8444 348670d6… Jan 03 20:47:13 1.5|1.1
-SB Height: 1372900 -Hash: 1ab2334e…
FULL_NODE 31.134.188.154 59968/8444 b79e548e… Jan 03 20:47:13 1.7|1.0
-SB Height: 1372900 -Hash: 1ab2334e…
FULL_NODE 118.254.252.73 15055/8444 b1753ac6… Jan 03 20:47:13 1.2|1.2
-SB Height: 1372900 -Hash: 1ab2334e…
FULL_NODE 2409:8a00:6cc8:46d0:9103:35e9:e35a:9258 52413/8444 6a242467… Jan 03 20:47:13 1.1|0.9
-SB Height: 1372899 -Hash: f33b643b…
FULL_NODE 115.216.6.86 55890/8444 de91ae82… Jan 03 20:47:13 1.1|1.1
-SB Height: 1372899 -Hash: f33b643b…
FULL_NODE 125.108.57.174 64508/8444 7f25d82c… Jan 03 20:47:13 1.5|2.0
-SB Height: 1372900 -Hash: 1ab2334e…
FULL_NODE 218.5.42.166 55758/8444 7d5c2714… Jan 03 20:47:13 1.2|1.1
-SB Height: 1372900 -Hash: 1ab2334e…
FULL_NODE 180.150.33.21 8444/8444 90f80ab1… Jan 03 20:47:13 1.4|1.5
-SB Height: 1372900 -Hash: 1ab2334e…
FULL_NODE 62.38.113.251 57890/8444 20bf90a8… Jan 03 20:47:13 1.1|1.3
-SB Height: 1372899 -Hash: f33b643b…
FULL_NODE 91.98.184.205 2247/8444 5ea65a19… Jan 03 20:47:13 1.5|1.0
-SB Height: 1372899 -Hash: f33b643b…
FULL_NODE 219.136.190.11 61729/8444 775c0962… Jan 03 20:47:13 1.3|1.2
-SB Height: 1372900 -Hash: 1ab2334e…
FULL_NODE 2409:8a50:e214:a410:847c:fc90:5f85:fcf9 56143/8444 ac97eec9… Jan 03 20:47:13 1.2|1.4
-SB Height: 1372900 -Hash: 1ab2334e…
FULL_NODE 46.23.51.108 8444/8444 b80045ae… Jan 03 20:47:13 1.0|1.9
-SB Height: 1372900 -Hash: 1ab2334e…
FULL_NODE 82.3.58.124 50413/8444 5a692d7d… Jan 03 20:47:13 1.4|3.7
-SB Height: 1372900 -Hash: 1ab2334e…
FULL_NODE 125.167.115.64 15205/8444 421cc320… Jan 03 20:47:13 1.2|0.9
-SB Height: 1372899 -Hash: f33b643b…
FULL_NODE 182.151.254.220 9089/8444 6ae3b62f… Jan 03 20:47:13 2.0|0.9
-SB Height: 1372900 -Hash: 1ab2334e…
FULL_NODE 113.89.203.222 56130/8444 ceb3658e… Jan 03 20:47:13 2.1|1.0
-SB Height: 1372899 -Hash: f33b643b…
FULL_NODE 77.29.20.205 48398/8444 6c994b9f… Jan 03 20:47:13 1.2|1.3
-SB Height: 1372900 -Hash: 1ab2334e…
FULL_NODE 60.168.98.65 18097/8444 d5802e1c… Jan 03 20:47:13 1.1|1.0
-SB Height: 1372900 -Hash: 1ab2334e…
FULL_NODE 120.229.13.36 4042/8444 117745d5… Jan 03 20:47:13 1.8|0.8
-SB Height: 1372899 -Hash: f33b643b…
FULL_NODE 193.9.123.22 35644/8444 f12f4f52… Jan 03 20:47:13 1.1|1.4
-SB Height: 1372900 -Hash: 1ab2334e…
FULL_NODE 2001:9b1:29fe:7a00::1012 60810/8444 63dbb50a… Jan 03 20:47:13 1.1|1.4
-SB Height: 1372900 -Hash: 1ab2334e…
FULL_NODE 240e:3a1:5653:6800:f1fd:e8a2:5d27:f013 61176/8444 82174c50… Jan 03 20:47:13 1.1|1.1
-SB Height: 1372900 -Hash: 1ab2334e…
FULL_NODE 171.127.35.79 49169/8444 ce865fda… Jan 03 20:47:13 1.1|1.2
-SB Height: 1372899 -Hash: f33b643b…
FULL_NODE 178.46.63.174 54286/8444 edfb3246… Jan 03 20:47:13 1.1|0.8
-SB Height: 1372900 -Hash: 1ab2334e…
FULL_NODE 2001:4c4e:2185:5700:d023:1917:98f1:8934 55017/8444 0f99b221… Jan 03 20:47:13 1.4|1.4
-SB Height: 1372899 -Hash: f33b643b…
FULL_NODE 117.10.62.14 52293/8444 31e34d39… Jan 03 20:47:13 1.0|0.8
-SB Height: 1372900 -Hash: 1ab2334e…
FULL_NODE 2001:8f8:173f:7457:b837:4323:2100:21cf 62104/8444 5c607a56… Jan 03 20:47:13 1.1|0.9
-SB Height: 1372900 -Hash: 1ab2334e…
FULL_NODE 89.111.119.57 52719/8444 48b43292… Jan 03 20:47:13 1.2|1.1
-SB Height: 1372899 -Hash: f33b643b…
FULL_NODE 94.180.206.174 62466/8444 a33ca9f8… Jan 03 20:47:13 1.5|0.8
-SB Height: 1372899 -Hash: f33b643b…
FULL_NODE 80.245.226.246 34723/8444 3d65035c… Jan 03 20:47:13 1.0|0.9
-SB Height: 1372900 -Hash: 1ab2334e…
FULL_NODE 175.166.96.151 9453/8444 ed6f02f3… Jan 03 20:47:13 1.9|1.0
-SB Height: 1372900 -Hash: 1ab2334e…
FULL_NODE 183.149.215.143 51769/8444 04f62d96… Jan 03 20:47:03 1.0|1.2
-SB Height: 1372899 -Hash: f33b643b…
FULL_NODE 217.114.225.118 8444/8444 36b479c8… Jan 03 20:47:13 0.9|0.9
-SB Height: 1372899 -Hash: f33b643b…
FULL_NODE 116.252.237.37 50736/8444 0b09ca5f… Jan 03 20:47:13 0.9|0.7
-SB Height: 1372899 -Hash: f33b643b…
FULL_NODE 46.209.98.242 56946/8444 136ab6c8… Jan 03 20:47:13 1.2|0.6
-SB Height: 1372900 -Hash: 1ab2334e…
FULL_NODE 62.197.243.27 49359/8444 60f99ae8… Jan 03 20:47:13 0.9|1.0
-SB Height: 1372900 -Hash: 1ab2334e…
FULL_NODE 177.139.57.140 59304/8444 238ca692… Jan 03 20:47:13 0.9|1.0
-SB Height: 1372899 -Hash: f33b643b…
FULL_NODE 89.216.188.158 34460/8444 5dcec4d4… Jan 03 20:47:13 0.9|2.6
-SB Height: 1372900 -Hash: 1ab2334e…
FULL_NODE 112.115.90.207 43851/8444 17bfe57c… Jan 03 20:47:13 0.9|0.7
-SB Height: 1372900 -Hash: 1ab2334e…
FULL_NODE 218.161.31.13 48402/8444 a18cb496… Jan 03 20:47:13 0.8|0.8
-SB Height: 1372900 -Hash: 1ab2334e…
FULL_NODE 61.193.128.198 60123/8444 67eec03f… Jan 03 20:47:13 0.9|0.5
-SB Height: 1372899 -Hash: f33b643b…
FULL_NODE 80.252.72.166 63591/8444 71c86a92… Jan 03 20:47:13 0.8|1.4
-SB Height: 1372900 -Hash: 1ab2334e…
FULL_NODE 1.68.116.185 16918/8444 b69eeea7… Jan 03 20:47:13 1.0|0.6
-SB Height: 1372899 -Hash: f33b643b…
FULL_NODE 113.117.0.132 39563/8444 138e68c2… Jan 03 20:47:13 0.9|0.9
-SB Height: 1372899 -Hash: f33b643b…
FULL_NODE 125.71.134.99 6276/8444 a87ac93f… Jan 03 20:47:13 0.8|1.0
-SB Height: 1372899 -Hash: f33b643b…
FULL_NODE 240e:3a1:580:921:3425:6a9f:dd75:f8de 61999/8444 c8484432… Jan 03 20:47:13 0.8|0.8
-SB Height: 1372900 -Hash: 1ab2334e…
FULL_NODE 68.197.22.152 50746/8444 18d55668… Jan 03 20:47:13 2.7|0.5
-SB Height: 1351227 -Hash: a8598a66…
FULL_NODE 2409:8a50:e214:a410:e80e:9f54:a1a9:eede 64853/8444 28cbacb8… Jan 03 20:47:13 0.9|0.7
-SB Height: 1372900 -Hash: 1ab2334e…
FULL_NODE 2409:8a20:481e:2150:8cb:9d1e:9d5:71d2 59935/8444 531c2565… Jan 03 20:47:13 0.6|0.5
-SB Height: 1372899 -Hash: f33b643b…
FULL_NODE 89.177.97.123 55835/8444 ade6ee7c… Jan 03 20:47:13 0.9|0.6
-SB Height: 1372899 -Hash: f33b643b…
FULL_NODE 172.111.223.72 64374/8444 8e89d2b4… Jan 03 20:47:13 1.1|0.5
-SB Height: 1372900 -Hash: 1ab2334e…
FULL_NODE 144.126.156.114 8444/8444 b89608bb… Jan 03 20:47:13 2.1|0.4
-SB Height: 1341012 -Hash: 889be4f5…
FULL_NODE 111.77.227.222 33778/8444 9e65803d… Jan 03 20:47:13 1.3|0.6
-SB Height: 1372900 -Hash: 1ab2334e…
FULL_NODE 122.231.124.126 54103/8444 e2152d87… Jan 03 20:47:13 0.5|0.4
-SB Height: 1372900 -Hash: 1ab2334e…
FULL_NODE 201.216.249.138 50497/8444 20a2fdfe… Jan 03 20:47:13 0.7|0.5
-SB Height: 1372900 -Hash: 1ab2334e…
FULL_NODE 171.107.203.42 64260/8444 5d9ee9f4… Jan 03 20:47:13 0.6|0.3
-SB Height: 1372899 -Hash: f33b643b…
FULL_NODE 49.93.135.3 30790/8444 34dc7dc3… Jan 03 20:45:14 1.2|0.3
-SB Height: 1372892 -Hash: 365d903b…
FULL_NODE 115.192.116.117 55473/8444 a8e98197… Jan 03 20:47:13 0.5|1.0
-SB Height: 1372900 -Hash: 1ab2334e…
FULL_NODE 223.96.101.35 10495/8444 40552375… Jan 03 20:47:13 0.3|0.2
-SB Height: 1372899 -Hash: f33b643b…
FULL_NODE 2403:6200:8832:788b:c425:fac7:d1c9:5811 58631/8444 03641f89… Jan 03 20:47:13 0.3|0.1
-SB Height: 1372900 -Hash: 1ab2334e…
FULL_NODE 58.17.12.45 63637/8444 a0e390d3… Jan 03 20:47:13 0.3|0.1
-SB Height: 1372900 -Hash: 1ab2334e…
FULL_NODE 39.149.60.152 48942/8444 d6202804… Jan 03 20:42:03 0.2|0.2
-SB Height: 1372881 -Hash: 4a82e792…
FULL_NODE 84.115.214.255 4068/8444 ae30a117… Jan 03 20:47:13 0.2|0.1
-SB Height: 1372899 -Hash: f33b643b…
FULL_NODE 2409:8a1e:92fa:8c30:c87f:ca77:ff12:939 8444/8444 9749bf94… Jan 03 20:47:13 0.1|0.6
-SB Height: 1372900 -Hash: 1ab2334e…
FULL_NODE 2a02:8308:b006:de00:a599:e32d:b269:e3e4 50664/8444 e93c1143… Jan 03 20:47:02 0.1|0.0
-SB Height: 711304 -Hash: d65e3308…
FULL_NODE 183.253.28.6 62271/8444 1796e55a… Jan 03 20:47:13 0.1|0.0
-SB Height: 1372900 -Hash: 1ab2334e…
FULL_NODE 202.28.248.40 7760/8444 22aab17b… Jan 03 20:47:13 0.1|0.1
-SB Height: 1307871 -Hash: b4be4400…
FULL_NODE 81.250.218.4 63557/8444 bd406247… Jan 03 20:47:13 0.0|0.0
-SB Height: 1372900 -Hash: 1ab2334e…
FULL_NODE 89.113.98.129 21580/8444 3385aa7c… Jan 03 20:47:13 0.0|0.0
-SB Height: 1372900 -Hash: 1ab2334e…
FULL_NODE 122.241.117.244 60331/8444 38ecde4a… Jan 03 20:47:13 0.0|0.0
-SB Height: 1372900 -Hash: 1ab2334e…

chia farm summary - not sure it is the same as the advanced options connection status, but if it does not show the local harvester…

Nope - connections aren’t shown with that command on mine…

Farming status: Farming
Local Harvester
274 plots of size: 27.118 TiB
Plot count for all harvesters: 274
Total size of plots: 27.118 TiB
Estimated network space: 33.876 EiB
Expected time to win: 8 months and 4 weeks
For details on farmed rewards and fees you should run ‘chia start wallet’ and ‘chia wallet show’

Forgot to ask which chia version you have. I kind of assumed v1.2.11.

I would move your swap either to your NVMe, or to HD. Also, would make it bigger (say 5G or so). You can run free to get the swap file usage.

What log level you have set in your config.yaml? Do you have it at INFO?

#4 That output indicates that your farmer is seeing your harvester (it passes challenges to it). However, it may be that your drives are sleeping?

#4.1/2. I am kind of afraid that this indicates no INFO log level. Especially, that #4.2 should be there, as it should kick in every 2 minutes (unless you made config.yaml changes), when harvester is rescanning for drives.

#5, That is just garbage output that should go to DEBUG level. The node should not be caring about those timeouts, as it has plenty of peers to work with.

Based on your “chia show -c” I would drop the number of peers down to 10 or so. RPi is not meant to run with 80 peers (or rather that code is basically broken):

full_node:
  target_peer_count: 10

Actually, that #4 response you have (took more than 5 secs) could indicate that everything that you return to your pool is basically stale. You should check on your pool, how many stales you have / what percentage it is (looks like 100%, at least right now).

I bumped the swapfile up to 4GB.
Chia version is 1.2.11

I did a chia configure -log-level=INFO, as it was set to WARNING. (CHIADOG requires INFO level from what I see).

I also reduced the peers down to 10.

Just did a restart to see what the output does for the logs…

In your config.yaml:

farmer:
  ...
  logging: &id001
  ...
    log_level: INFO

I am also using ChiaDog :slight_smile:

Started it back up now, and waiting to see if I have any harvester events…

If at INFO you can do

tail -n 100000 ~/.chia/mainnet/log/debug.log | grep -v '0 proofs' | egrep '(proofs|partial)'

To get output like this

2021-12-31T13:01:44.352 harvester chia.harvester.harvester: INFO     5 plots were eligible for farming 1cf2978eaa... Found 1 proofs. Time: 0.55753 s. Total 1747 plots
2021-12-31T13:01:44.396 farmer chia.farmer.farmer         : INFO     Submitting partial for 09361088ad1a4de4059459e14557d53118d4df2783fb5dd337xxxxxxxxxxxxxxx to https://eu1.pool.space
2021-12-31T13:02:08.001 harvester chia.harvester.harvester: INFO     3 plots were eligible for farming 1cf2978eaa... Found 1 proofs. Time: 0.69416 s. Total 1747 plots
2021-12-31T13:02:08.047 farmer chia.farmer.farmer         : INFO     Submitting partial for 09361088ad1a4de4059459e14557d53118d4df2783fb5dd337xxxxxxxxxxxxxxx to https://eu1.pool.space

If harvester and farmer are doing as they should the Found proofs time should be < few sec preferably. And the farmer should forward the signed partial within milliseconds after the harvester finding the proof.

I tried that and got no output at all on the debug.log :frowning:

Just run

grep harvester debug.log

Do you get any output from that?

With 274 plots it will take a while for a challenge to pass filter ánd find a solution/proof.
Let it run for a while and check back.

Ok, got some results…

2022-01-03T21:28:55.469 harvester chia.harvester.harvester: INFO 0 plots were eligible for farming 31676e1a89… Found 0 proofs. Time: 0.11632 s. Total 274 plots
2022-01-03T21:29:04.198 harvester chia.harvester.harvester: INFO 0 plots were eligible for farming 31676e1a89… Found 0 proofs. Time: 0.11874 s. Total 274 plots
2022-01-03T21:29:14.820 harvester chia.harvester.harvester: INFO 0 plots were eligible for farming 31676e1a89… Found 0 proofs. Time: 0.12480 s. Total 274 plots
2022-01-03T21:29:23.854 harvester chia.harvester.harvester: INFO 0 plots were eligible for farming 31676e1a89… Found 0 proofs. Time: 0.09998 s. Total 274 plots
2022-01-03T21:29:31.634 harvester chia.harvester.harvester: INFO 1 plots were eligible for farming 31676e1a89… Found 0 proofs. Time: 0.15238 s. Total 274 plots
2022-01-03T21:29:44.046 harvester chia.harvester.harvester: INFO 0 plots were eligible for farming 31676e1a89… Found 0 proofs. Time: 0.12348 s. Total 274 plots
2022-01-03T21:29:52.346 harvester chia.harvester.harvester: INFO 1 plots were eligible for farming 31676e1a89… Found 0 proofs. Time: 0.16767 s. Total 274 plots
2022-01-03T21:30:02.391 harvester chia.harvester.harvester: INFO 1 plots were eligible for farming 31676e1a89… Found 0 proofs. Time: 0.17138 s. Total 274 plots
2022-01-03T21:30:11.875 harvester chia.harvester.harvester: INFO 0 plots were eligible for farming 31676e1a89… Found 0 proofs. Time: 0.12345 s. Total 274 plots
2022-01-03T21:30:21.666 harvester chia.harvester.harvester: INFO 1 plots were eligible for farming 31676e1a89… Found 0 proofs. Time: 0.16469 s. Total 274 plots
2022-01-03T21:30:30.165 harvester chia.harvester.harvester: INFO 0 plots were eligible for farming 31676e1a89… Found 0 proofs. Time: 0.12692 s. Total 274 plots
2022-01-03T21:30:38.879 harvester chia.harvester.harvester: INFO 1 plots were eligible for farming 31676e1a89… Found 0 proofs. Time: 0.15523 s. Total 274 plots
2022-01-03T21:30:47.684 harvester chia.harvester.harvester: INFO 1 plots were eligible for farming 31676e1a89… Found 0 proofs. Time: 0.24943 s. Total 274 plots
2022-01-03T21:30:52.135 harvester chia.harvester.harvester: INFO refresh_batch: event started, loaded 0, removed 0, processed 0, remaining 274, duration: 0.00 seconds
2022-01-03T21:30:52.298 harvester chia.harvester.harvester: INFO refresh_batch: event batch_processed, loaded 0, removed 0, processed 274, remaining 0, duration: 0.07 seconds
2022-01-03T21:30:52.299 harvester chia.harvester.harvester: INFO refresh_batch: event done, loaded 0, removed 0, processed 274, remaining 0, duration: 0.07 seconds
2022-01-03T21:30:56.294 harvester chia.harvester.harvester: INFO 0 plots were eligible for farming 31676e1a89… Found 0 proofs. Time: 0.12324 s. Total 274 plots
2022-01-03T21:31:06.748 harvester chia.harvester.harvester: INFO 0 plots were eligible for farming 31676e1a89… Found 0 proofs. Time: 0.10318 s. Total 274 plots
2022-01-03T21:31:15.217 harvester chia.harvester.harvester: INFO 1 plots were eligible for farming 31676e1a89… Found 0 proofs. Time: 0.21797 s. Total 274 plots
2022-01-03T21:31:23.596 harvester chia.harvester.harvester: INFO 0 plots were eligible for farming 31676e1a89… Found 0 proofs. Time: 0.11001 s. Total 274 plots
2022-01-03T21:31:32.715 harvester chia.harvester.harvester: INFO 0 plots were eligible for farming 31676e1a89… Found 0 proofs. Time: 0.10297 s. Total 274 plots
2022-01-03T21:31:41.488 harvester chia.harvester.harvester: INFO 0 plots were eligible for farming 31676e1a89… Found 0 proofs. Time: 0.12252 s. Total 274 plots
2022-01-03T21:31:52.451 harvester chia.harvester.harvester: INFO 0 plots were eligible for farming 31676e1a89… Found 0 proofs. Time: 0.12496 s. Total 274 plots
2022-01-03T21:32:02.184 harvester chia.harvester.harvester: INFO 0 plots were eligible for farming 31676e1a89… Found 0 proofs. Time: 0.12141 s. Total 274 plots
2022-01-03T21:32:12.147 harvester chia.harvester.harvester: INFO 2 plots were eligible for farming 31676e1a89… Found 0 proofs. Time: 0.26559 s. Total 274 plots
2022-01-03T21:32:20.898 harvester chia.harvester.harvester: INFO 2 plots were eligible for farming 31676e1a89… Found 0 proofs. Time: 0.23101 s. Total 274 plots
2022-01-03T21:32:31.641 harvester chia.harvester.harvester: INFO 0 plots were eligible for farming 31676e1a89… Found 0 proofs. Time: 0.12074 s. Total 274 plots
2022-01-03T21:32:41.182 harvester chia.harvester.harvester: INFO 0 plots were eligible for farming 31676e1a89… Found 0 proofs. Time: 0.11394 s. Total 274 plots
2022-01-03T21:32:49.670 harvester chia.harvester.harvester: INFO 1 plots were eligible for farming 31676e1a89… Found 0 proofs. Time: 0.22754 s. Total 274 plots
2022-01-03T21:32:52.648 harvester chia.harvester.harvester: INFO refresh_batch: event started, loaded 0, removed 0, processed 0, remaining 274, duration: 0.00 seconds
2022-01-03T21:32:52.788 harvester chia.harvester.harvester: INFO refresh_batch: event batch_processed, loaded 0, removed 0, processed 274, remaining 0, duration: 0.04 seconds
2022-01-03T21:32:52.789 harvester chia.harvester.harvester: INFO refresh_batch: event done, loaded 0, removed 0, processed 274, remaining 0, duration: 0.04 seconds
2022-01-03T21:32:58.816 harvester chia.harvester.harvester: INFO 0 plots were eligible for farming 1ebfa477ad… Found 0 proofs. Time: 0.27067 s. Total 274 plots
2022-01-03T21:33:11.850 harvester chia.harvester.harvester: INFO 0 plots were eligible for farming 1ebfa477ad… Found 0 proofs. Time: 0.10309 s. Total 274 plots
2022-01-03T21:33:21.674 harvester chia.harvester.harvester: INFO 1 plots were eligible for farming 1ebfa477ad… Found 0 proofs. Time: 0.17553 s. Total 274 plots
2022-01-03T21:33:31.810 harvester chia.harvester.harvester: INFO 0 plots were eligible for farming 1ebfa477ad… Found 0 proofs. Time: 0.12167 s. Total 274 plots

Also got something back from Chiadog finally, but perhaps from changing the log level…
It previously wasn’t reporting the last line below (detected new plots.)

I’ll leave it running for a while and see if the changes to the config.yaml and the 1GB → 4GB increase in swapfile helped…

[2022-01-03 21:28:25] [ INFO] — Starting Chiadog (v0.7.0) (main.py:54)
[2022-01-03 21:28:25] [ INFO] — Enabled local file log consumer. (log_consumer.py:59)
[2022-01-03 21:28:25] [ INFO] — Enabled remote pinging to XXXXXXXXXXXXXXXXXXXXx
[2022-01-03 21:28:25] [ INFO] — Keep-alive check period: 300 seconds (keep_alive_monitor.py:45)
[2022-01-03 21:28:25] [ INFO] — Initializing Email notifier. (smtp_notifier.py:16)
[2022-01-03 21:28:25] [ INFO] — Enabled stats for daily notifications (stats_manager.py:48)
[2022-01-03 21:28:25] [ INFO] — Summary notifications will be sent out every 24 hours starting from 21:00 (stats_manager.py:61)
[2022-01-03 21:28:25] [ INFO] — Enabled parser for harvester activity - eligible plot events. (harvester_activity_parser.py:32)
[2022-01-03 21:28:25] [ INFO] — Enabled check for farming events. (time_since_last_farm_event.py:22)
[2022-01-03 21:28:25] [ INFO] — Enabled check for non-decreasing total plot count. (non_decreasing_plots.py:18)
[2022-01-03 21:28:25] [ INFO] — Enabled check for time taken to respond to challenges. (quick_plot_search_time.py:18)
[2022-01-03 21:28:25] [ INFO] — Enabled parser for partial submitting stats. (partial_parser.py:28)
[2022-01-03 21:28:25] [ INFO] — Enabled parser for block found stats. (block_parser.py:28)
[2022-01-03 21:28:25] [ INFO] — Enabled check for found blocks. (found_blocks.py:15)
[2022-01-03 21:28:25] [ INFO] — Enabled parser for finished signage points. (finished_signage_point_parser.py:28)
[2022-01-03 21:28:25] [ INFO] — Enabled check for finished signage points. (non_skipped_signage_points.py:19)
[2022-01-03 21:28:25] [ INFO] — Enabled parser for wallet activity - added coins. (wallet_added_coin_parser.py:26)
[2022-01-03 21:28:29] [ INFO] — Detected new plots. Farming with 274 plots. (non_decreasing_plots.py:26)

That’s good! We have INFO output, and we know that farmer talks with harvester. We also know that so far your drives are not sleeping.

Put a tail on your debug.log

tail -f debug.log | grep WARNING

It can eventually show whether your disks will disconnect, or you are running fine if there is no output.

Go to your pool, check whether it is getting partials. Also, check for stales.

Yes, if debug.log is not overwhelmed (dust storm), you should see that last line there (about your plots), every time you restart it.