Hi there professionals!
I made my research, tried to make some plots and now i am sitting on my new HW and i dont know whats are the optimal stats.
Yesturday i tried to run 10 queues (7 on 2TB temp drive, 3 on 1 TB temp drive) at same time, but finish time was over 40000 sec. (bad)
Setting was : - 3800 RAM, 2 threads
I am using GUI apk.
I was thinking to try 4 threads (per plot) and make parallel Plots (5KS - 6KS) with about 180 minutes waiting (phase 1) - after that 20-24 threads of the processor should be used.
Can anybody with more experiences help me to optimize it?
    CPU is limited by this formula: (Cores + Threads)/2 - **12**
    RAM is limited by this formula: (Total System RAM)/3400 - **14**
    Temp Space is limited by this formula: (Total Temp Space)GB/256GB - **10**
So yes, that is mean that i can do 10 plots at once, but the plotting time in this setup was so slow (40K sec) … ( Time for phase 1 = 17692.607 seconds. CPU (140.740%) )
Now i making a 3 paraller in 3 queues (all three with 90 minutes delay, 4000MB/4 thread per plot) and the time of phase 1 is allmost twice time faster. But the CPU load is between 50 - 80% of use. I think that i dont using my potencial at full load.
1ts queue
Time for phase 1 = 9895.486 seconds. CPU (204.420%) Wed May 5 15:22:43 2021
2nd queue
Time for phase 1 = 9771.293 seconds. CPU (203.750%) Wed May 5 15:21:24 2021
3rd queue
Time for phase 1 = 9970.187 seconds. CPU (203.170%) Wed May 5 15:26:04 2021
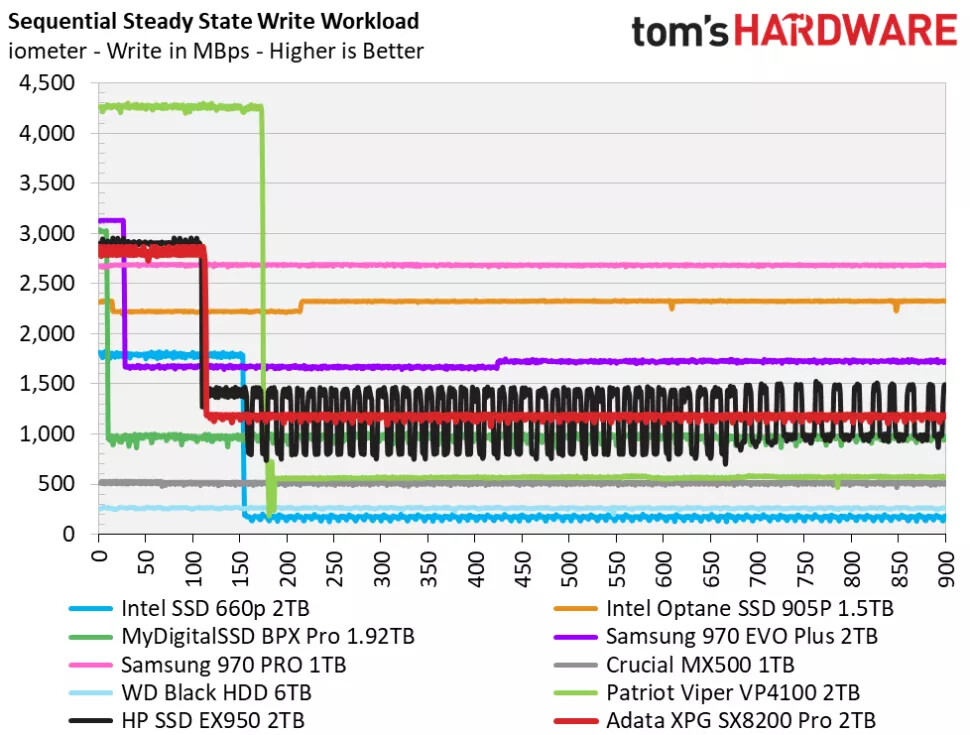
I’m not sure if the same thing happens to the VPN100, but I suspect that is the case also. You can test it with iometer if you want to find out. Each plot does 1.4TBW so its easy to overload the cache when parallel plotting.
I’m still trying to find the answer to that myself, SSDs don’t advertise the performance metric that iometer performs on a drive. From the graph you can see that the 970 PRO stays consistent but the TBW is only 1200 (Which is still a lot).


 …
…