this is a dumb question I am sure. But isn’t the PCie 2.0 vs 4 dependent on the motherboard? or can I change something somewhere to effect that?
It is just weird I have almost 400 plots and this didn’t start happening until the last 30 or so.
maybe some weird bios update / crash or something happened. Try to figure it out. Maybe the motherboard had a power failure and reset all settings to failsafe? Poke around in the bios and let me know if it fixes it
After a reboot, and you start your first madmax plotting job, is that job slow right from the get-go, or do things run well for a while and later slow down?
What I am driving at is if you have a period of things running normally, then you should capture the folling information from Task Manager’s “Performance” tab:
– CPU
– Memory
– Disk 0 (C:) (your boot drive)
– Disk 4 (D:) (your temp plotting drive)
Note that your D: drive might get assigned a different Disk number after a re-boot. So capture the information from the drive that you are using as your temp plotting drive. It will retain the letter “D:”, but might not retain the same Task Manager “Disk” number.
If your C: drive inexplicably becomes very active midway during a plotting job, it could be due to you using virtual memory, and that will slow things down, especially if your C: drive is not non-cache friendly (not all SSD drives are fast when their cache runs out, and they turn into pigs until their cache is freed up).
By having Task Manager screen captures of each of the above items, we will be able to see which of your key plotting resources is busy (an how much so), and which ones are taking a stroll.
Please be sure to click on each resource, so that we can see the details in Task Manager’s right-side panel.
Ideally, get screen captures, of each of the above mentioned Task Manager items, when things are running properly, and then, again, when things slow down.
If things are slow all of the time, then of course only those screen captures will be needed.
One other possibility is that your D: drive (your temp plotting SSD drive) might be out of cache. A re-boot will probably not help. The drive will free up its cache only as the computer sits idle (or, only when you are not running jobs that write to the drive). The drive will free up its cache in the background, when it is not busy. That could take a fair amount of time, depending on the quality of the drive.
Which model drive is your temp plotting drive?
What type of motherboard do you have (model number) you can the spec on the slots and what they are labeled for speed. pcie 2.0, pcie 3.0, pcie 4.0 etc
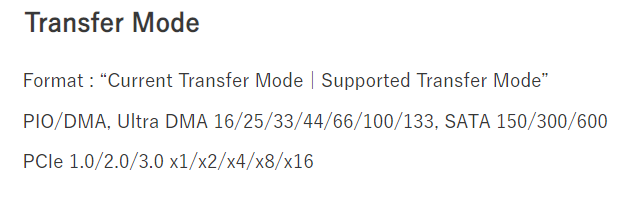
See this :
![]()
If you hover your mouse over these two numbers, the 1st says it is what your SSD is running at currently. The 2nd number is what your motherboard supports and it would run a PCI-E 4.0 SSD at if it was installed.
You haven’t said what the brand/model of your SSD is, but I’m not sure I can even remember if there were PCI-E 2.0 SSDs (probably). Nevertheless, it should work, but in today’s world this is very strange indeed. You need to sus this out and get your SSD back to the current world (i.e., either PCI-E 3.0 or 4.0). That may not fix your issue, but it’s a start.
My motherboard is old and is only rated at Pcie 2.0 I’ll get the model number out later. But i did look it up last night.
What you say shouldn’t be correct IOW it doesn’t make sense, unless CrystalDiskInfo is not working correctly. It indicates you have your SSD in a PCI-E 4.0 motherboard slot. From the sw manual online >
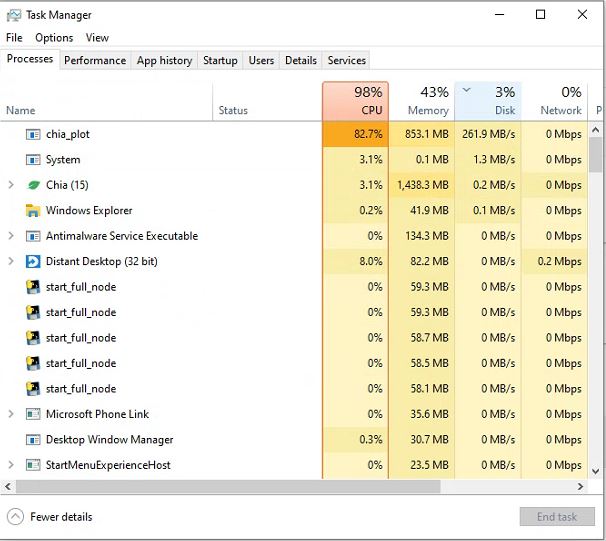
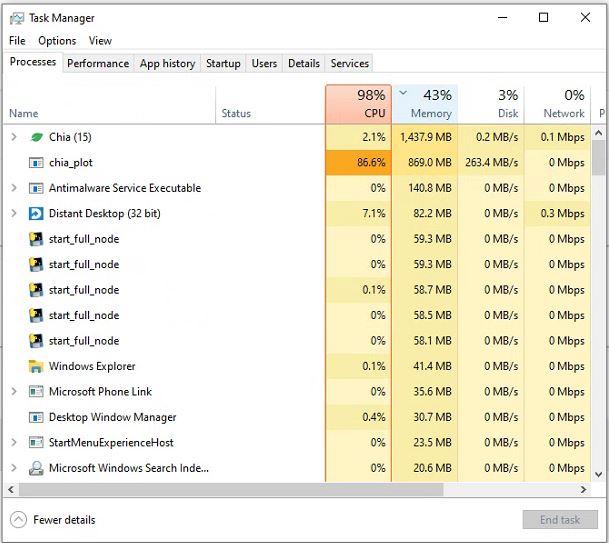
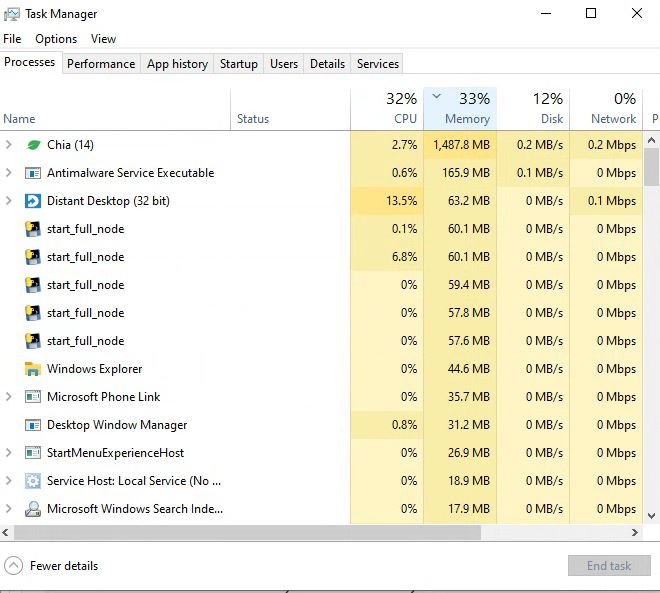
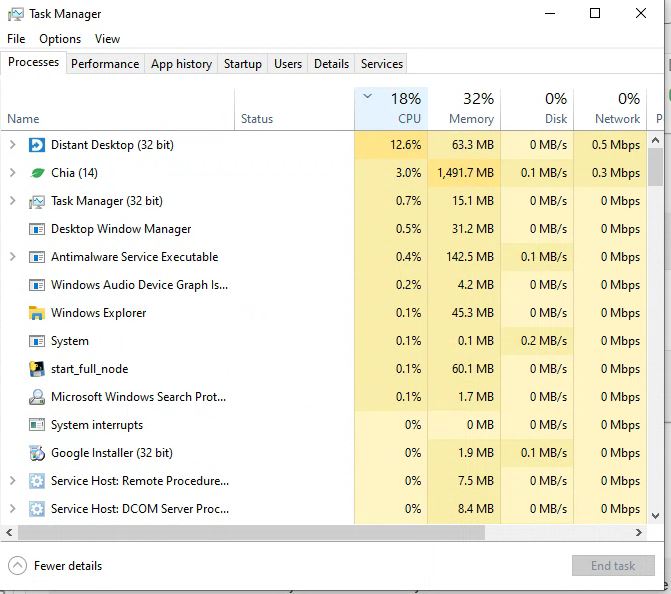
I have not been plotting all day and just started a plot. Here are shots of my performance and process.
I am almost certain that when it is hanging I do not see the process chia _ plot. We’ll see if it freezes up again later tonight and I’ll send new screen grabs.
Thanks


Yes, certainly CrystalDiskInfo is nuts! You certainly do not have PCI-E 4.0 What is going on…???
I wish i knew. Its so weird it work for the last few months fine then just started freezing.
What exactly is your problem right now?
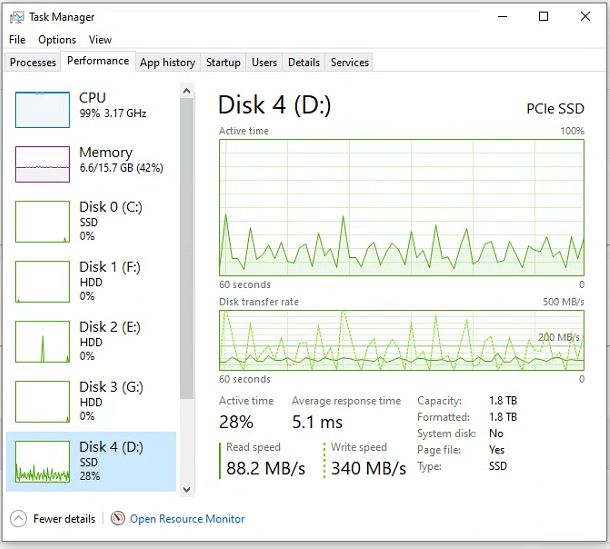
Your CPU is maxed out and is running at basically full speed, so there is no thermal throttling (good). Your NVMe is running at standard SATA speeds (~500 MBps, it may go higher, but we don’t know that) and it only uses 25% of the available bandwidth (good, there is a headroom to use it for plotting and move finished plots in parallel). No other visible drive has any activity (so move is already done or not visible disk is being used). So, all that says that you are getting out of this box everything it can deliver (during the plotting phase).
You mentioned that your final move phase takes 40 mins or so, what would indicate that the problem is on the HD side, rather than your box. If this is the problem, then could you get a screenshot during the copy phase. Possibly just make one plot, and get a screenshot when plotting is done and the only process is the final move. Although, even assuming that there is a problem on this side, your NVMe has plenty of headroom to be used by both plotter and move.
So, looks to me that nothing on those screenshots indicates any problems.
Maybe you could run Crystal Disk Mark test for your NVMe and HD that shows that slowdown and post it here.
Sounds good. Yes its running fine right now. Yesterday it sat on 85% of a plot for 12 hours or more before i stopped it. Ill keep watching and try to get some screen shots if it acts up again.
1 Like
85% is still good if that is just chia_plot (most likely would imply that MM is waiting on NVMe, maybe Phase 3 or 4 iirc). You need to get a screenshot from the Processes page (at such time), as possibly some other process is chewing a big part of the CPU. Still, I would think that MM would get whatever is left, thus maxing CPU during such time.
Also, when you check the CPU page, check the frequency your CPU has at that time (whether it dropped to some really low level).
By the way, this is an old box, did you de-dust your CPU heatsink / radiator? This may cause the CPU to overheat, thus drop the frequency and stall your plotting. Also, in this case your NVMe, final HD should be basically idle.
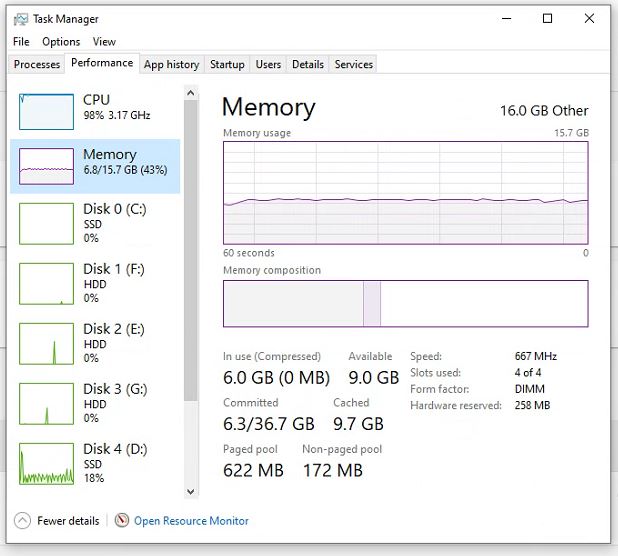
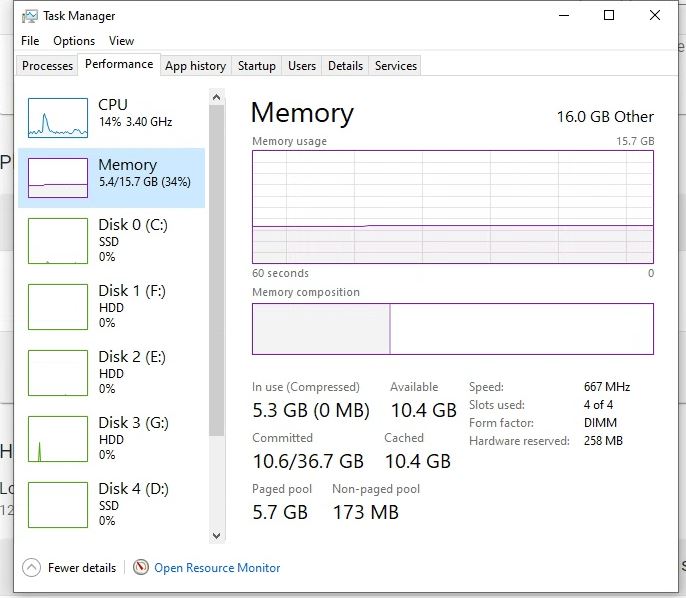
By the way, your RAM was running at 667 MHz at that time. Do you recall what RAM you have, is that DDR3? Maybe you need to watch that frequency as well when it will slow down the next time.
1 Like
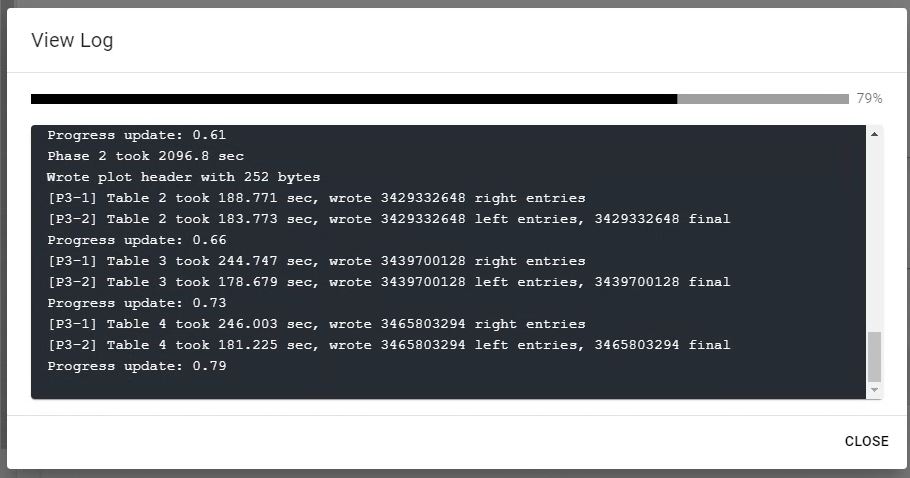
Ok, it’s stuck again I believe. I’m sitting at 79% of my first plot since I restarted.
I don’t see any drop in frequency or any process really going crazy. I guess the only weird thing to me is the memory is straight across not up and down. It is DDR3 and it says it’s at 667.
I have not cleaned of the cpu but by the numbers it looks fine. I’ve seen the frequency go from 3.35 to 3.45 or so.


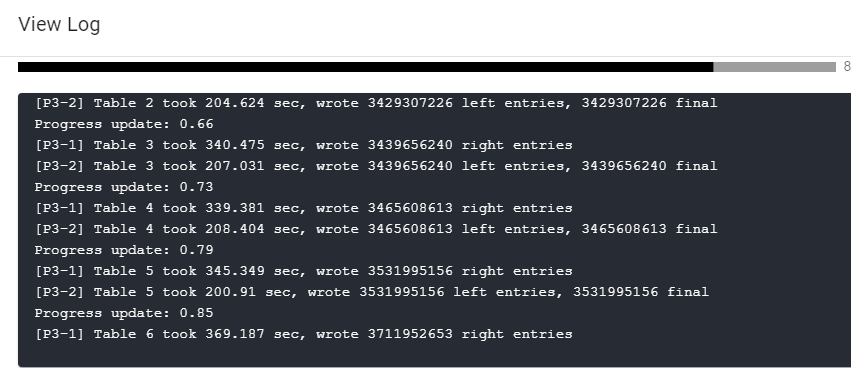
Here is the log where I am at now. I have been on 79% of this plot for about 90 minutes. Is this the phase where it goes from the temp drive to writing it in ram, and then to the final hard drive?
I’m wondering if there is something wrong with my memory.
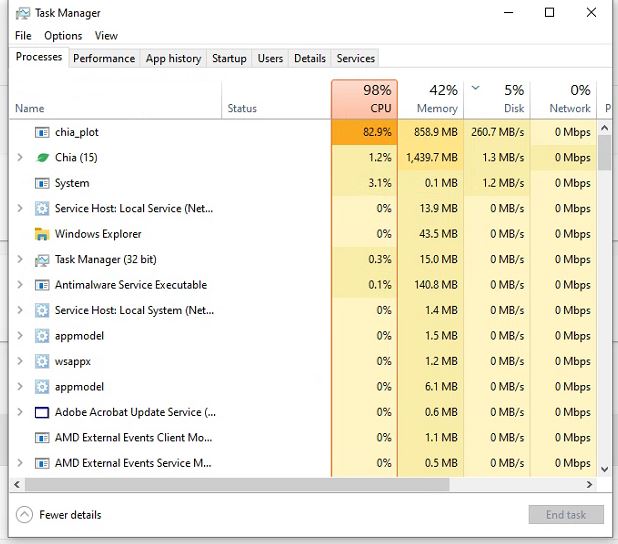
Are you running MM via CLI or GUI? chia_plot is not on those Processes screenshot. Maybe you could sort it by name, find that chia_plot, so we can see what it is doing.
Through the GUI interface in the chia wallet I’m on 1.6.2 but it started happening on 1.6.1
I’ve done about 350 plots before this started happening.
I guess the first time it happened I went from running a cue of 10 or 16 at a time to I tried to do a cue of 64 and it locked up. Then I got it back going for a few plots, and now it’s back to locking up.