What would be the factor that affect “complete sub slot” and to improve this.
I did some google and it say 64 signage is 1 sub slot but how to make sure this is improve and best optimized?
Did you read the link i posted from gill?
It seems sub plots are not that important necessarily.
Once your node has been up for 24hrs without you messing with it, repost another screen shot from farmr pls.
Because if after 24 hrs without you messing with it you are still seeing really long responses or missed challenges i think that will be what needs investigating.
I have just under 1/3 of your plots. I run an old cpu ( fx 8350 ) and my times very very rarely go over 10 sec.
What are the specs of your node?
What is your setup, 1 main node im guessing?
How many harvesters?
Thank you for the help.
I will send another screenshot tomorrow.
I’m running 1 full node.
i7 9700 3.8Ghz
16Gb memory
Chia is on 500Gb SATA SSD
OS; Windows
connected to 4x JBOD via 2 x12Gb SAS card.
Each JBOD has a direct SAS link (not chained)
This machine is purely for Chia farming so nothing else is running on it.
I plot on other rig and move the HDD to the JBOD once full.
These rigs are not connected to the internet.
Nothing has changed on the machine but the last drop I got was 2nd May.
Just thought its been a while and I’m paranoid something is wrong.
thanks again
1 Like
I think that 1sec average may not be really the issue. If his distribution would be a perfect bell curve, that would imply that half of his proofs are below 1 sec, and half between 1 and 2 secs. Also, the median is 0.9 sec, that further suggest not that many are over 5 secs. We know that the right side is not perfect, but, it has to be close (with just few outliers over 5 secs).
My thinking was that moving plots over the wire was causing those bursts, but as HDs are moved, that is ruled out. This leaves us with either drives going to sleep, or having bad sectors. (Not sure what else could be.) If drives would be going to sleep, that would imply that drives are rather small (main part of the filter is done in memory), as such we should see a bunch of 10-20 secs there. What kind of suggests that maybe there are bad clusters on those drives.
Another option (don’t have a clue about it), is that those JBODs are acting up from time to time (some internal scan kicks in every so often???). Although, that may be not the case, as those are server grade devices, so performance is the king with those.
So, maybe chkdsk would be warranted to go over those drives. I (personally) would go for smartctl long scan (smartctl -t long /dev/sdb), as this one doesn’t really care about the file structure, but surface integrity. (chkdsk would be much faster, so I would start with it)
With such CPU, you should not need to reduce the number of peers, as that mostly is needed for slower CPUs and db on HDs. However, I would check in Task Manager your RAM utilization, and would get another 16GB of RAM.
By the way, I am on v1.3.3 and am also 3-4x behind schedule, and all looks clean. However, seeing this thread, I upgraded to v1.3.5 today. The initial v1.3.0 was messing up payout addresses, so maybe there were some code quirks with lower than v1.3.5.
Being 6-7x behind is not really being paranoid, as that should not happen too often. You have a big farm, so you should see more outliers, still that is kind of high.
1 Like
My high response would only pop up 2-3 times a day.
It seem to be on similar time of the day as well and they are all over random drives.
My last drop was on 1.3.3, 2nd May.
I was paranoid the older version is affecting my win so I updated to 1.3.4 on the 11th May. which the GUI was a mess, and lucky they release 1.3.5 on the 12th.
Same shit here since 1.3.4 / 1.3.5. Won last block like 6-8 weeks ago. Should win in 2-3 Weeks.
1 Like
The long win wait could be bad luck however…
This is an issue, even if a small one and IMO needs further investigation.
Im not saying its not to do with the software, but that is totally normal and will happen at times.
Exactly what I’ve seen, I won in May 2021, again in June, then started pooling late August as no wins and won a few days later on 23 August, then nothing until March this year (most that 6 months was 2 Month ETW), then two weeks later won again, and nothing since. I’ve had an ETW of 1 month since since the end of March.
I know my system is working well as I’m pooling and running Farmr, just the way it goes sometimes, but always worth checking everything through.
My brother runs two systems, one at his house the other at his girlfriends, not a 50/50 split of plotted space, but every win he’s had has been at his house, and I think he’s had five or six.
1 Like
so here is the screenshot after 24 hrs
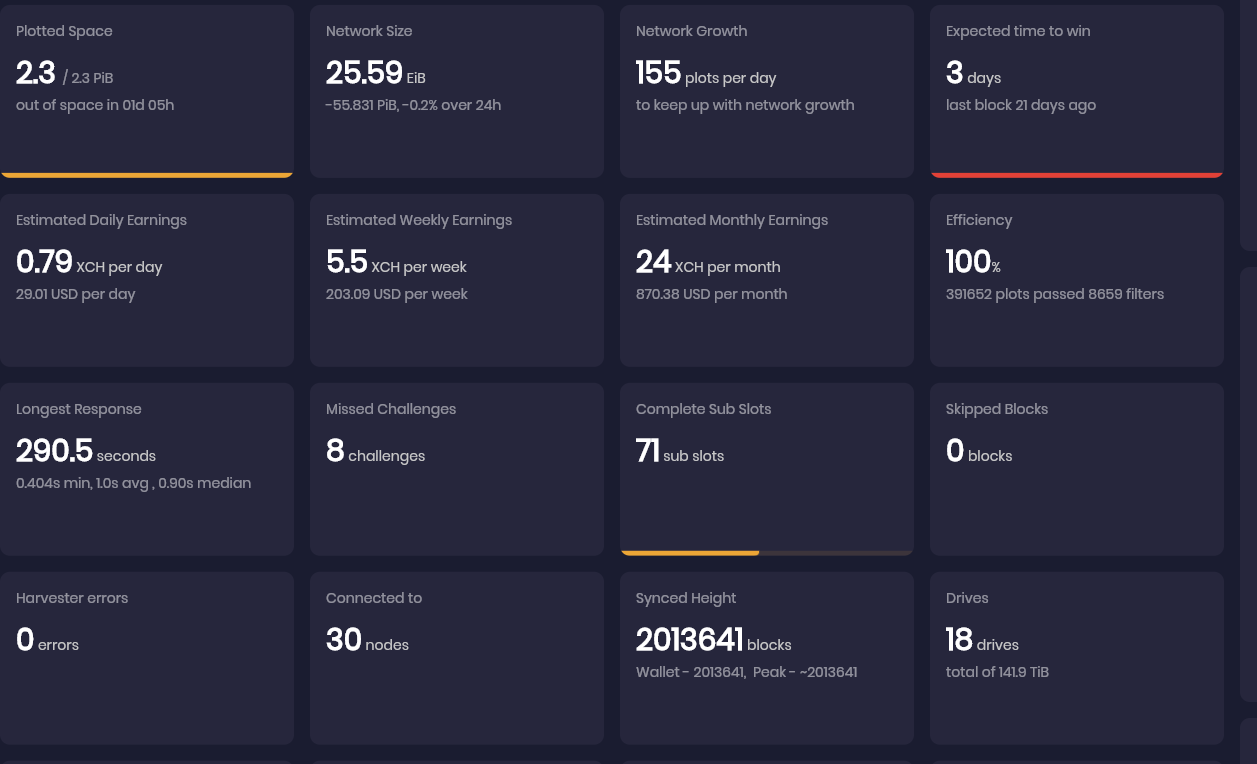
I checked the log; since I restarted the farm there are around 2589 warning about response time.
84% of these are from when the plots are loading in the farm, hence the 290.5s.
The other warning showed up in 2 batches at different time of the day they are all <40s
That’s a true head scratcher… but 5 minutes almost to access a file or files? Holy toledo!!
The closest thing I’ve had to this is the following:
2022-05-20T10:12:33.541 harvester chia.harvester.harvester: WARNING Looking up qualities on E:\18TB\18\plot-k33-2022-04-18-19-09- …d6.plot took: 20.828892707824707. This should be below 5 seconds to minimize risk of losing rewards.
I checked around, and found other long lookups on the same file, some up to 50+ seconds.
From that I determined that there was some problem with the file itself, perhap happening during a copy process. So I simply deleted the file.
Almost immediately, max lookup times fell mack to ~max 1.5 sec on a few lookups a day. This is my typical occurrence on ~1-2% of lookups. So maybe investigate that as a source of the problem? Otherwise you need to do more deep dive into what’s going on … but the issue is severe certainly… 5 minutes?! Yikes!
Also, about the initial read of plot files … I have almost 6000, and that takes a few seconds, maybe 20-30 to complete on USB drives… so there should be no issue if the disk and connection subsystem is working correctly, I would think. Further those times do not effect my farmr times either, they are apparently excluded (or happen within 30 sec block lookup periods so aren’t noticed).
1 Like
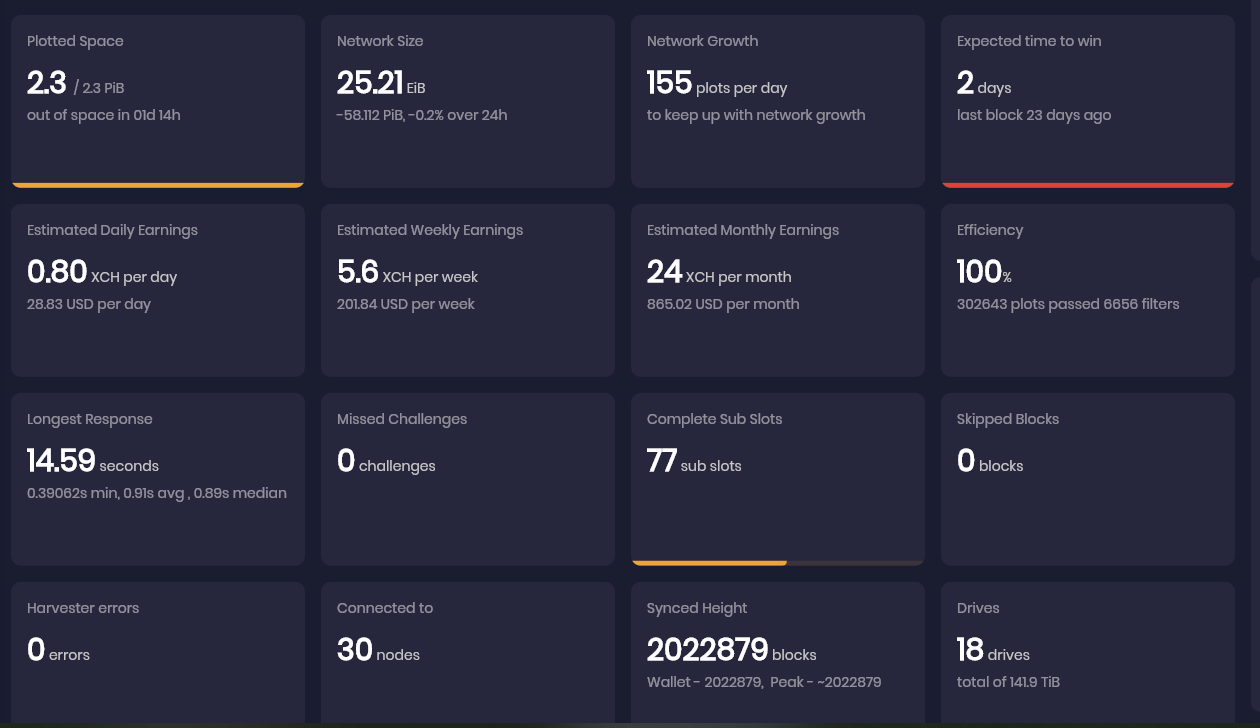
I’m still getting a few episode of high response time.
Just upgraded the memory to 32Gb and see if this will help. ![]()
And plots check won’t find these bad guys???
Just completed plot check after 4 days ![]()
5 bad plots, I have removed them.
The high response time its all on random plots.
As in that post, plot check has really not much value for the end user. It looks like it was meant for devs to do regression tests in case the chia plotter was updated (or to check other plotters (MM, BB) for “purity”), and just as an afterthought was exposed in the production code.
To make it somehow better for end users, the min number of tests should be reduced to just 1 (everything else is just a waste of time, as the seed is the same, and changing the seed and/or starting position may / will produce contradictory results) to speed up the basic plot structure test.
The second change would be to disable plot checks all together, so it would not interfere with checking for dups (of course, checking for dups is also useless as it is, as it doesn’t check against the farm, but rather the local harvester).
By default, harvester will try to parallelize plot scans, and it may be (was before) that when SAS / SATA i/o will get saturated, the delay will start growing exponentially. So, maybe it would be worthwhile to play with scan parameters and to disable parallel scans. Especially, if drives are moved around (not just sending plots over the wire), there is really no reason for those scans at all, as manual rescan can be forced after adding new drives.
  plots_refresh_parameter:
    batch_size: 300
    batch_sleep_milliseconds: 1    // I would try to increase it to 10-100 (ms) or so
    interval_seconds: 300          // this can easily be increased to just once per day for a big farm
    retry_invalid_seconds: 1200

  parallel_read: True              // I would try to switch it to False, just to see whether it helps
By the way, could you post your line (from debug log):
harvester chia.harvester.harvester: INFO _plot_refresh_callback: event done, ... duration: 0.08 seconds
That “duration: …” is the time it took harvester to scan all drives. Also, whether those lines are close to your longer lookups.
Got this one at 12:59
2022-05-24T12:59:44.955 harvester chia.harvester.harvester: INFO _plot_refresh_callback: event done, loaded 0, removed 0, processed 23296, remaining 0, duration: 0.92 seconds, total plots: 23296
then had a batch of long response at 13:01 but this time after memory upgrade not passing 14s.
then
2022-05-24T13:02:00.419 harvester chia.harvester.harvester: INFO _plot_refresh_callback: event done, loaded 0, removed 0, processed 23296, remaining 0, duration: 0.94 seconds, total plots: 23296
Yeah, sorry, I checked my logs, and am a bit confused about those scans. When my harvester starts, it takes about 9 minutes to scan all my plots (an order of magnitude+ less plots than your harvester shows). On the other hand, when doing successive scans, it takes just 0.08 sec. So, not checking the code it is hard to say why there is such difference. Most likely, when a new plot is found, some basic plot checks (header integrity) are being performed, thus the successive scans don’t have that overhead.
Although, as scan is done in batches (by default 300 at a time), most likely looking up proofs is enabled right after the very first batch is found. That could potentially explain why your long lookups are present when harvester is started. Assuming that your initial scan takes 30 minutes, your lookups during that time may really suffer.
So, maybe there is no point to worry about those initial slow lookups (during the initial scan, most likely HDs are bogged down with parallel reads / seeks). Still, the two lines you posted show that your scans are running every two/three minutes and there is really no reason for that. Just increase that “interval_seconds” to one day (62,400).
Although, the default value for those scans is 300 sec / 5 mins. Not sure, how come you only have 3 mins difference.
If you can see your log files from a Linux box, I would run something like that:
cat debug.log* | grep “plots were eligible” | grep -v -e “Time: 0.” -e “Time: 1.” -e “Time: 2.”
grep "Looking up qualities on" opal/debug.log*| tr " " "\t" | cut -f 10 |sort
and
grep "Looking up qualities on" opal/debug.log*| tr " " "\t" | cut -f 10 |sort |uniq -d
The first one will show all lookups over 5 sec, the second will show just those plots that had multiple problems. Maybe that will identify HDs that have more problems than others?
I have a couple of drives that from time to time have 5 or 6 secs lookups, but I really cannot tell why. @Fuzeguy tip about killing those with the longest lookups is most likely the best option you could do. (I am running smartctl on one of those drives, but it will take a day to finish, although, it doesn’t look like it interferes with lookups so it may be a good idea to run it in your case as well (SMART params are all good, chkdsk didn’t show any problems in my case).
How much memory do you have now on that node??
went from 16Gb to 32Gb
2 Likes