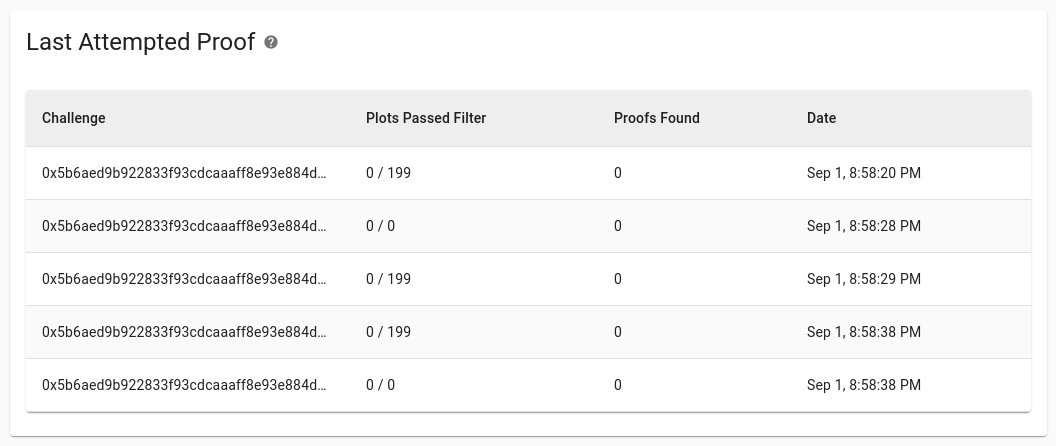
a friend of mine was visiting me today and we checked our Chia Plotting setup and noticed that in my Full Node in the statistics very often attempts to farm a block fail, or how should we interpret the following table? My friend says that he has not observed this on his node yet. If the behavior is not normal, where can we suspect the cause?
That is normally a harvester not having any folders/plots to check. The 0/199 is probably the node itself. The 0/0 is probably a harvester reporting to the node that has no plots or the plot folders configured incorrectly.
The data comes from a Harvester on a Synology NAS, which is connected to an Ubuntu Full Node. It does not seem to be a general error, since it is not permanent and matches are found. The harvester also reports the correct number of plots to the node (except for one, which is somehow missing from the beginning). All plots are displayed in the node in green and with a farming status. Can I run a health check on the harvester or on the Node or otherwise check the configuration? Is there an error log on the harvester or node?
What I’m saying is that there are two harvesters reporting. One with 199 plots and one with 0 plots. If the one with zero plots is a mistake, you just need to tell it to stop reporting. If it is supposed to have plots on it, then fix it.
Hi @Cyberduck, run “chia plots check” on both harvesters and they should show and check plots for validity.
If one doesn’t show any plots then check the directories that it is configured for with “chia plots show”, which shows the plot directories that it is configured for.
Search your debug.log file on both harvesters for the entries below. If you didn’t modify config.yaml, they show up every two minutes.
2021-08-22T12:01:53.823 harvester chia.plotting.plot_tools: INFO     Searching directories ['f:\\chia\\pool', 'h:\\chia\\pool']
2021-08-22T12:01:53.854 harvester chia.plotting.plot_tools: INFO     Loaded a total of 310 plots of size 30.68163017419556 TiB, in 0.046859025955200195 seconds
The first line tells you which folders are being searched. The second, the number of plots found in those folders.
If you have plots found on both harvesters, but you still see those 0/0 in the UI, open a bug report on Chia github.
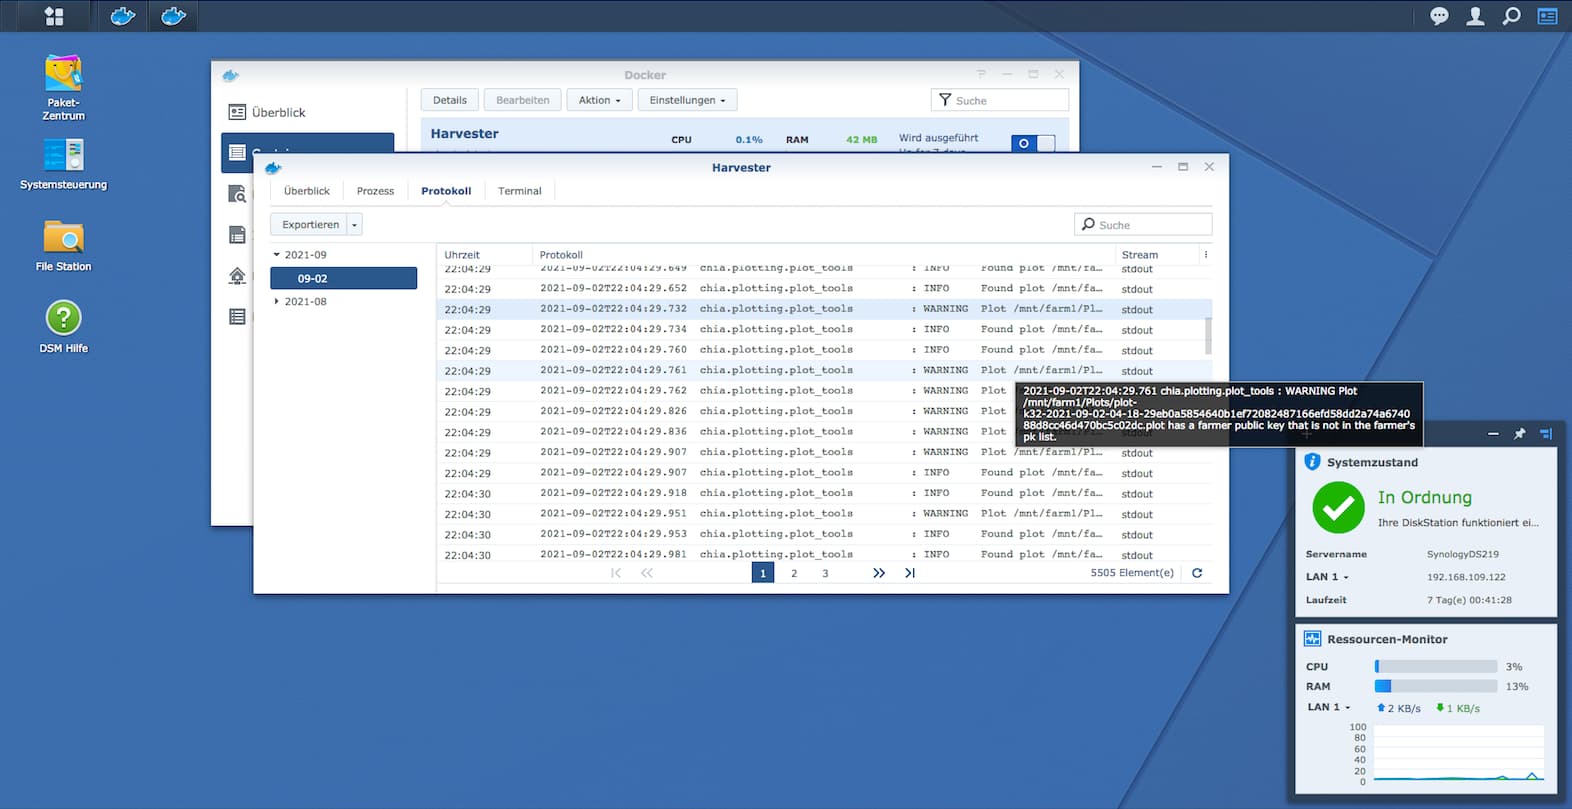
I found the following forum post and there the conclusion was that this warning can be ignored on a harvester-only machine. I don’t know if this is the current status. Everything after that seems to be ok.
I have executed the command in a terminal in the Docker Station and now have to wait for that to finish running, that may take some time now. In the meantime I have established a root shell with SSH to the Synology NAS and connected to the Docker container, but I can’t execute any chia commands there. I don’t know now if I have to switch to the virtual envirionment again with the ./activate command and rather wait for the output of the first command.
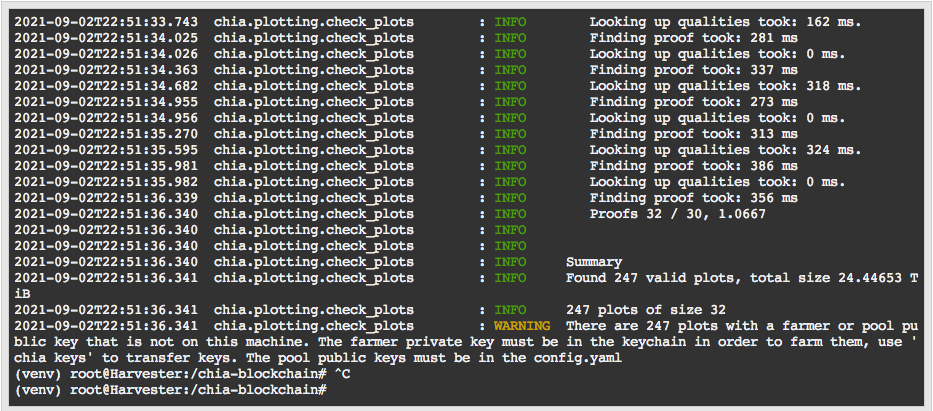
Half an hour later: The warning applies to all plots but in the end this actually seems not to be something to worry about too much. All plots are apparently valid.
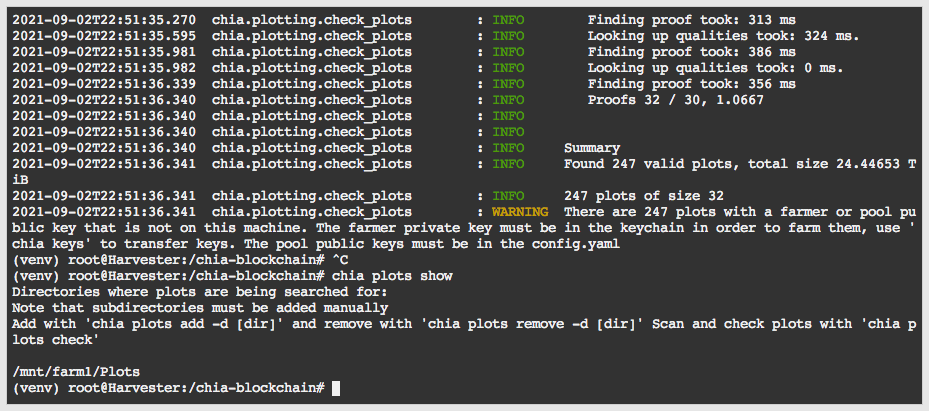
The second command returns the following. I don’t believe that there is no directory configured, because it’s not that nothing works. I’m just lagging behind in performance, although I host significantly more plots than my colleague.
can we just confirm that the plots that are on the Synology were created with the same farmer key that you are farming on (the GUI)?
From my chair, I can’t definitively confirm that because not all plots were created on my plotters. There are two of us, but we should both use the same Farmer and Pool ID. In the GUI I only see that each plot is linked to the same pool contract ID.
However, over the night I have made significant progress in the distribution of the partials. This morning I am at 58:42, which is about the same as the split of the plots. Yesterday it was at 36:64, which I found very disturbing. I have no idea what the network is reacting to…
Anyway, is there a command that shows me the farmer key of the plots?
so I talked to my colleague and he confirmed that all the plots were created with the same Farmer ID. Verifying this in the Docker VM was an impossibility because the output of the command runs so fast and takes so long that I had no way to analyze the output and also the shell’s buffer was not big enough to scroll back to the beginning. Piping the output to a file to analyze it afterwards didn’t work either, no idea why.
But we have another theory, where the 0/0 entries come from. First the node was a harvester and since the installation of the harvester in a Docker VM on the Synology NAS it only acts as a node. Maybe the node is still as harvester configured that has no connection to the plots anymore. Can I verify this somehow or would I then have to set something in the Node finally so that it no longer tries to harvest? But this is only our attempt to explain this phenomenon. Is it plausible?
Btw: With increasing number of plots on the Synology NAS the question arises how much data the harvester on the Docker VM can handle performant at all? Currently we host about 40TB of plots there and about 4TB is added daily and when the NAS is full it will be about 170TB. Can the harvester handle that on the Docker VM? I mean it has to do all the work alone after plotting ist done…
You can do the plot check with the name of a plot file and it will just check and output one. Make sure that the farmer and public keys are 100% correct (every character).
Do you mean your Ubuntu gui pc? That could be 0/0 if it has no direct plots, yes. Though I’m not sure it shows 0/0 if it has no plots itself, but it quite likely could.
I’ve run 140TB of plots on a synology NAS and the processor and memory remains very low. No issues there.
there is a chia_harvester process running on the node and the node should not actually be harvesting at all. The harvester is running on another machine. I don’t know if this is by design or if I can or should disable this process.
It has been mentioned elsewhere that the node may be responsible for the entries 0/199 but if the 0/0 comes from a harvester that has no plots to farm, I suspect that this is still the old harvester process when the node was also a harvester. If the whole thing has no negative impact, we do not have to open a big barrel now, but if it affects the profit, I would like to have the problem solved…
You disable the process by removing the setup you used to create the Harvester.
So ( thh don’t actually remember how I set up my harvesters, drinking tonight ). But somewhere we ( looks at comp to verify ) set our ssl keys.
If you delete your ssl keys from. Config.yaml it should stop acting as a harvester, and stop showing 0/0.
I had the same issue, but I shut down chia on my harvester and the 0/0 vanished.
I plot with MM, so you don’t need chia gui up and running on harvester, and i would assume you have the same issue, running a full chia client that you don’t need to be running.