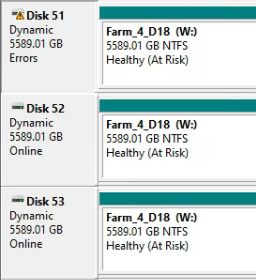
Well, it appears I was right about the W: drive but wrong about it not showing errors. I was about to run HDTune but it just brings up a list of drives with no identifying information of the drives. So I needed to know what drive (out of the 60 drives on the system) to run the test on. So I brought up Disk Manager to get the drive number. That is when I saw this.
On that I can easily see that one of the drives in the W: drive stripe set is showing “Errors”. So, it looks like I found my problem.
While in there, I looked at all the rest of the drives and there are no others showing the Errors status. Still going to run the HDTune to see what it says.
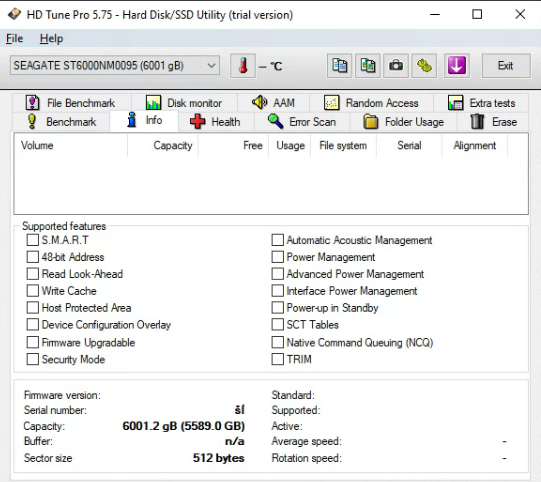
Unfortunately, it does not show information for the drives in the JBOD. This is what the info tab shows for the JBOD drives.
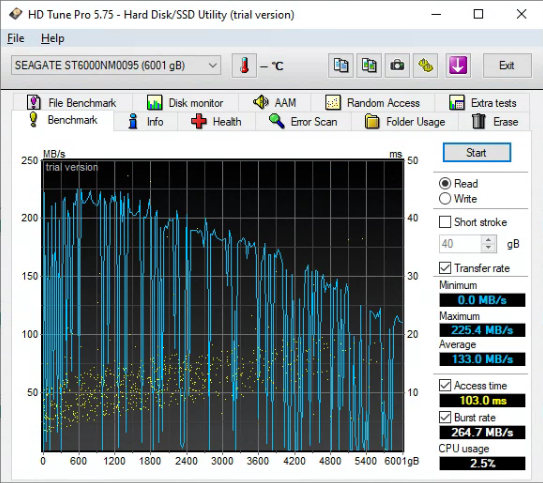
The good thing is that it does list all the drives in order in the dropdown. So I just counted down to find the one I needed. This was the benchmark for the suspected drive.
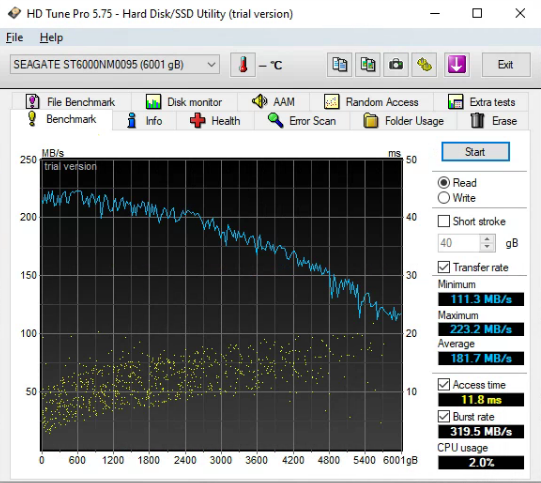
And this is the benchmark for the drive that replaced it.
The drive was so bad that I was not able to copy the plots from it. They appeared to be there when you browsed, but they would not copy. So I lost 165 plots. Oh well. That is why I have them split up in small groups of drives. It will take a couple days to replace but that’s fine. There have been no slow lookups since the W: drive was removed. Looks like the problem is solved.
Just to clarify, the issue of latency in searching for plots was isolated to that one specific drive, correct? It did not affect your overall Chia system or the ‘good’ drives from being able to farm. Right? So if you hadn’t noticed this lookup time error for months, the worse case is that you had one drive that was doing nothing for your farming win potential. But every other drive still had the opportunity to win a Chia block. Right?
Incorrect. The problem with the one drive being bad affected more than just lookups to that drive. The reason is that lets say you have “9 plots were eligible for farming …”. If one of those 9 plots were on the bad drive it would cause a delay. That delay would not only cause problems for that plot but also the other 8 because the delayed lookup would also delay the others in that cycle.
This is why it took me a bit to even identify the problem. Because I was seeing delays for many drives in the logs. I finally noticed that in every timestamp range of issues, it included that one drive among the others. Then I started looking at it.
Ahh. Interesting. Good to know and thanks for sharing. I didn’t see it this way before. So essentially each harvester can only respond in a timeframe that is defined by the slowest drive of all drives it is harvesting. So it is critical to either fix that one drive or simply remove it. Thanks again.
I think what is being said is that the total lookup time taken to look up the plot on the slowest drive will be added to the total time taken to lookup plots on the other drives.
I think that’s pretty obvious, but then the response is provided as a group of lookups for each eligible plot, rather than individually per eligible plot?
I hadn’t really thought about it until you pointed it out. If you grep ‘eligible’ in your debug log file, you’ll see the response time. It appears that this time represents the total time for identifying eligible plots from all plots that that particular harvester (computer) is managing.
‘x plots were eligible for farming’ … ‘Time: y seconds. Total z plots’
That’s the bit I don’t think is being written quite right and it sent me down the wrong path before. If one of them is slow, the total response will be slow, for that particular lookup, if that lookup includes a plot from the slow drive. Right?
This vs if one of them is slow they all are - sounds like all my plots and their lookups will always be slow.
It has been said multiple times. You are confusing yourself. If a set of eligible plots contains a plot on the bad drive, all the lookups in that set will be delayed/slow.
Not sure what you mean by multiple times - I guess people have said it before and I haven’t seen that? I’m not confusing myself at all - was trying to get the context of it. And you just confirmed what I said. All lookups in ‘the set’. So yes that’s it - we agree.
looks like same issue as mine but mine being more severe and stops farming completely.
a single drive in raid array under disk management will show it, but otherwise CHIA doesnt say much. hes lucky it could tell him latency while mine just says host not responding making it look like an internet or port issue. dumb software.
Yes, in the debug log. But you don’t get that information if everything is running smoothly. The way I found the plot location is when they do run slow it tells you “W:/folder/plotname.plt took ** seconds. This should be below 5 seconds ***”.
And right before that message, you will see “5 plots were eligible for farming **”. And it will list out the 5 plots and how long they took. In my case, every time I had an entry (or group of entries) there was always at least one plot in the group on the W: drive. Which turned out to be the drive with the problem. Eliminated the bad drive, problem went away.
Thank you. Yeah, in the last log I didn’t have those lookups over 5 secs, so didn’t see that output. Although, I had some around 2-3 seconds and was thinking that maybe those could be coming from the same USB drive, and was hoping that there is a way to identify those as well.
It would be nice to have a param in config.yaml that would specify when those warnings should hit the log, so we could potentially better tune our farms.
I just posted this in GH (might be my first post there):
I second the request. I have spent a lot of time trying to diagnose the long lookup times barking up the wrong tree (USB hubs, USB extension cables, Win power mgmt, Win indexing, virus scan, bios settings, windows updates, task scheduler, LSI HBA card firmware update, overloading Ivy Bridge pc, internet speed, home network load) and finally diagnosed it to a particular HDD that actually appears ok in SMART reports.
Removing the offending HDD eliminated the warning messages for long lookup times. I probably could have done something more systematic use a spreadsheet or 3rd party program to see which HDD comes up the most in long lookup times, but after eyeballing the warning messages, it was able to find out which HDD was slow. I probably should check it out using HDtune now.
This has happened again. Another of my 6TB SAS drives started going bad. Looking back at this post helped me find it quickly. I caught it early so the entire stripe set was not trash. Just moved all the plots off (except for 5 that were corrupt). Used HDTune to find the specific drive because it wasn’t even showing issues in Disk Management (yet). As HDTune was running its test, Disk Management finally tagged it as a problem. Now replacing the drive with a spare that I bought when I replaced the first one. Will move plots back later today. Nice not needing to replot the entire 167 plots.