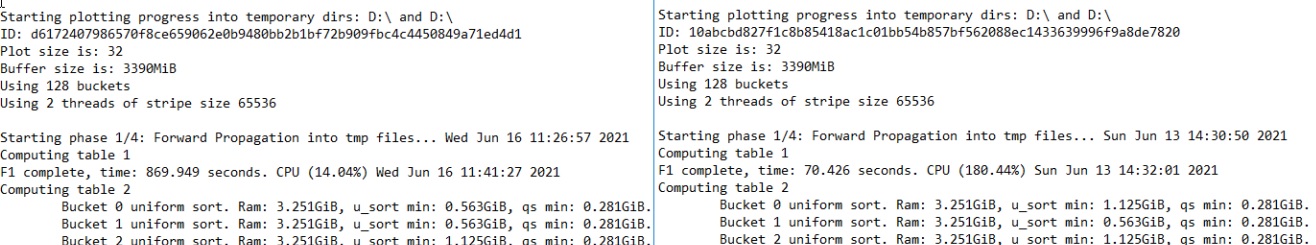
Hi, I’m new at this, read a lot - can’t tell what happened… can anyone explain me and maybe suggest a solution: few days ago I had cpu usage around 150+% (in logs [no errors/warnings]), now around 20-50% (going on default plot settings for test all the time). Doesn’t matter of it is in parallel or single plot, it happens now all the time, in every phase (especially seen in 1-2).
CPU: i5 9600, shitty 16 GB 2666Mhz RAM, 1TB Crucial P5. Mini-fresh-windows with nothing interrupting in background processes.
First time I had 5h/single plot, 8h/3 in parallel. Now it’s about 2x longer in any case.
If nothing else has changed in your system then this loss is mysterious to me.
Try using 4 threads per parallel. This may help your phase 1 time but is not the answer you seek.
Another suggestion given your memory and plotting drive size would be testing production of a single K33 and then 2 parallel K33s (which is the most your present setup can handle and is equivalent to producing 4 K32s).
One K33 is a bit easier on the cpu than 2 K32s parallel. My machine and most low to mid range plotters will produce more TiB plotted if plotting K33s. Our machines bottleneck at the CPU, not the plotting drive.
There is a long thread here about the advantages of plotting K33, K34, and K35 if you are interested.
@Aspy68 I’ll try with 4 threads as you suggest, I shall notice if this CPU use goes up. I also will look for that other k$ plotting thread. Thanks for suggestion. @slippers this trimming sounds curious, but I can’t say that I know how to look at it. You mean it should be only one file on temp drive while plotting? Or is it written somewhere in logs?
Also, I don’t know why is same place (D:) twice, I thought that should look like this Of course destination is other drive than temp, and I didn’t messed up drives (no plotting on HDD, only transfer).
 Of course destination is other drive than temp, and I didn’t messed up drives (no plotting on HDD, only transfer).