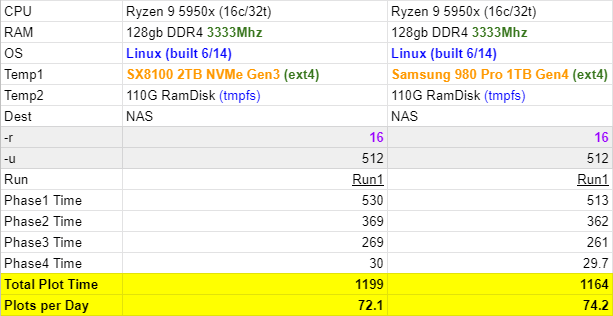
Totally not impressed with my move from the Gen3 SX8100 SSD to the Gen4 Samsung 980 Pro. Both are 1st runs (freshly trimmed, no file copy operations in progress, basically best case for each nvme drive). Only picked up 30s. =( Anyone have any ideas?
Totally not impressed with my move from the Gen3 SX8100 SSD to the Gen4 Samsung 980 Pro. Both are 1st runs (freshly trimmed, no file copy operations in progress, basically best case for each nvme drive). Only picked up 30s. =( Anyone have any ideas?
I have a very similar configuration: i9-10850k running all-cores stable at 4.9GHz, 32GB DDR4@3200MHz G.Skill Ripjaws V (XMP but running at 2666 only, I’m not able to make it running higher than that), 2x 1TB MP600 in RAID-0 XFS with crc=0.
Plot is taking 33 minutes, ~43 plots a day.
I’m wondering if there’s a lot room for improvement, it seems for this CPU and SSD something close to 50 plots a day is already the best case scenario from what I read from other comments.
Nevertheless I will try with 32GB DDR Crucial LPX 3600 to see if it improves something.
Update: just replaced with DDR LPX Vengeance 3600 CL18 and plot times are more or less the same, ~32 minutes per plot. I tried with bucket size 128 and 512 but it doesn’t get better. I’m using 30 threads, average CPU usage is 80%, with 24 threads was like 1 minute slower and 75% usage, not sure if it was due to that really. I’m assuming I’m already taking the most of this hardware.
Any thoughts?
Ryzen 5950x supports memory frequency up to 3200MHz.
Did you have any difference in plot speed between 3200 and 3333 MHz?
I’ve seen huge performance changes from 2400mhz to 3333mhz. I’ve not specifically tested 3200 vs 3400. I believe ultimately memory bandwidth is the limiter (This was mentioned numerous times in Tuesday’s chia livestream too). I’m actually pissed I can’t get this 3600mhz ram to run at 3600mhz (despite the official 5950x spec being 3200). I’m going to play with looser timings and higher clock speeds this weekend to see if it helps, maybe will try to OC the 5950x a touch too (so far haven’t tried that). I’d like to get in the <1000s club if I can 
PS the infinity fabric can go up to 1800mhz and retain 1:1, thats why 3600mhz should be the sweet spot. But I think my mobo or CPU is acting very finicky. Even to get this 3333mhz I had to set timings manually, XMP (3600mhz) would not allow the system to boot for some odd reason when using all 4x32gb ram sticks (128gb total), and after 3 failed restarts would downclock to 2400mhz. In 2x32gb (64gb total) I can run 3600mhz no problem. This seems odd to think its a memory controller problem, but others have said running full 128gb at high clockspeed is harder than 32gb or 64gb. But since chia plotting is super memory bandwidth intensive, its in all our best interest to push our ram speeds (and infinity clock) as high as possible.
-Dan
I wonder if the temp 1 speeds needs to be that high at all.
I’m not up to date on the specific writes during the process (this topic has gotten too long to read)
But let’s consider the following:
25% of the writes is on temp1, that’s 325 GB total per plot.
Now let’s say it only writes to that disk for 25% of the plot time
325GB/300 second = about 1000MB/s
Maybe there’s a phase/part where it tries to write at lot at once to temp1, but it seems like the temp1 speed benefit will be capped at some point.
Tend to agree with you on the 25%/75%. Oddly if you let the temp1 get beaten up and don’t trim it, even phase1 times get impacted significantly. Right now I still am seeing CPU at only 70-75% in phase1, 50% in phase2/3. Originally I thought my gen3 NVMe was holding me back, but maybe thats not the case and its all memory bandwidth right now… I’ve tried -r 16 and 32, but so far I haven’t found a way to get 100% CPU usage from my 5950x in ubuntu with madmax
Why 325GB?
From plotter doc:
<tmpdir> needs about 220 GiB space, it will handle about 25% of all writes. (Examples: './', '/mnt/tmp/')
<tmpdir2> needs about 110 GiB space and ideally is a RAM drive, it will handle about 75% of all writes.
Combined (tmpdir + tmpdir2) peak disk usage is less than 256 GiB.
And your calculations didn’t consider rewrites.
one plot still writes 1.3 TB in total, right?
25% of 1.3 TB = 325 GB
You can setup an rtrim event by using task scheduler. I run rtrim hourly. By default it runs weekly but that isn’t enough for plotting.
Better do it while fully stopped. Performing “while” plotting, it sometimes foks* things up.
Mine runs constantly while plotting. I’ve never had an issue. Not even once.
Same for me too, might hurt that runs time by a couple of seconds, but nothing disastrous.
I got once making the drive completely red and then made it invalid, had to reformat and remount it.
When you say remount it, it sounds like you are on a linux environmnet. This retrim is a Windows thing. I know linux has a trim function also and they are very similar and accomplish basically the same thing. But maybe the implementation is different enough to allow it to run in Windows hourly (during plotting) without issues. Just a thought.
what is the command in windows to run rtrim?
To perform trim/optimization automatically recognizing all drive types (run as admin):
defrag /C /O
You can find a discussion about it here (along with the command to add to your task scheduler).
You can use powershell and do:
Optimize-Volume -DriveLetter T -ReTrim -Verbose
Windows will not trim a RAID though so my plot times keep rising(until I format)…wish I could switch to linux but the fact I use USB HDDs, linux is a pain with them…
I use stotiks 0.0.5 now, which was 6% faster than 0.0.4 which I used before
