Hey everyone – I’ve been stalking this forum for a month now and thought I’d finally make a contribution. I downloaded the new v0.0.6 of the Windows MadMax ‘Fury Road’ plotter today and did some light optimization to try and get some quicker times out of my machine. The biggest feature this version has to offer is different buckets for phase 3+4 than phase 1. I methodically changed variables one at a time to dial in my rig, and this new function really seemed to make a huge impact. My experiment follows:
My machine:
AMD 5950X on a B550-A Pro
128GB 3000MHz DDR4 RAM
Temp Drive 1 - Sabrent Rocket 4TB
Temp Drive 2 - RAM Disk (110GB)
OC provided by AMD Ryzen Master (Where applicable)
Results:
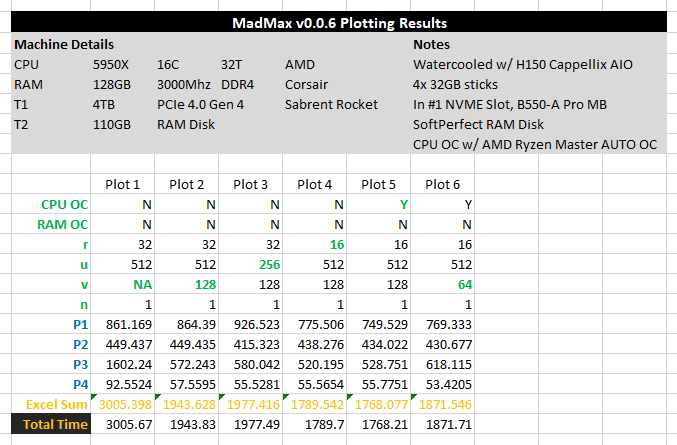
A screenshot of my excel spreadsheet used to track progress is pretty self-explanatory.
Each attempt is labeled Plot X, and the variable changed is in BOLD/Green. I changed one variable at a time because #science. Initial values on Plot 1 were based on what I read here. The best results were achieved on Plot 5. You can see the effect changing variables had on the times I recorded in each Phase. I believe it proves speculation on this forum that 16T is better than 32T for the 5950 and then 512 buckets is fantastic for P1, but not so much for P3+4. 128 buckets is ideal for P3+4. Less than 128 buckets was also suboptimal. The effects of very basic OC are also evident and I am certainly leaving something on the table having just simply clicked ‘AUTO OC’ in Ryzen Master. I think a 1600-ish plot time is possible with what I’ve got.
Based on this testing session, I recommend folks with the 5950X try buckets at 512 for P1, 128 for P3+4, and plot for 16T with some sort of OC they know to run well. This set up will churn out 50+ plots per day.
Thanks to all who have posted here and helped me over the last month!
Happy to answer any questions on my set up or approach.
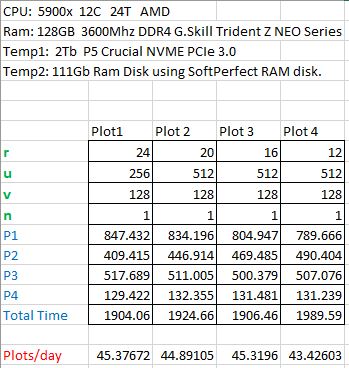
Thanks for the breakdown, gave me some incentive to do this on my 5900x setup. For mine I think I will run it at 16 threads in the Plot 3 tab, with 45.3916 plots/day, instead of the 24 threads I have been running and killing the cpu with no overhead.
So i did a little bit of my own research yesterday and this is the result.
I’m using a Lenovo Thinkstation 500 with a 14 Core Xeon 2697v3, 64GB Ram and an Intel Optane P4800x as the only drive.
This machine cost me about 950€ inkl. the 375gb Optane SSD.
CPU: Intel Xeon E5 2697 v3 14c
RAM: 64GB 2133Mhz
Temp1+2: Intel Optane P4800X 375GB
Same drive, not 2 seperate, actually faster using it for both than using
Parker1c,
Got the same machine; and pretty much the same results. Doesn’t like 512 buckets either. 24T/256B is my fasters sub 2300 time.
I, also, haven’t tried the 0.0.6 version on the xeon, as I am pretty much out of plottable space, but I am gonna be looking forward to your test results.
Although, I am willing to bet it won’t be much different from Ahayu’s results in the post above yours.
Interesting experiment would be to fire it up under Linux and test it against Windows. People do report huge improvements in time, wondering how it is going to look for a v3 Xeon.
Should there be a difference between 8 and 16 threads? I have a Ryzen 7 2700x with NVME and 128GB ram using a 111GB ram drive. I’ve been plotting with 14 threads the last few days since I got the system. Saw this thread … I’ve been going through the different U and V values. And, i’m running through 8 threads at the moment … it does not seem like the times change compared to the 16 thread ones.
How come the 5950X is so slow? Is it because of Windows? Or the slow RAM? I have no RAMDisk and use one 980 pro for both T1 and T2 on a 5900X and I get 1550 seconds per plot.
What are your settings? I haven’t gone back to see what I can speed up; I am simultaneously GPU mining so that could be taxing me a little on time…Only other thing I can think of is my RAM clock speeds at 3000mhz. Tell us a little more about how you’re getting those great times!
Nothing special, I only set 24 threads and tmp1 and tmp2 on the 980 pro. Everything else is default. and yes, I have seen a jump from 45 to 55 plots per day when I switched from 3200 to 3600 RAM and activated PBO in the bios.
My 5800x is doing one plot every ~30 mins (or 48 plots per day). Nothing’s special, no PBO in bios (which I probably should do when I have time). Ubuntu Server 20.0.4.
Crafting plot 43 out of -1
Process ID: 3261
Number of Threads: 16
Number of Buckets P1:    2^8 (256)
Number of Buckets P3+P4: 2^8 (256)
...
Working Directory:   /Volumes/ssd1/tmp/
Working Directory 2: /mnt/ram/
Plot Name: plot-k32-2021-06-25-11-14-2d4a23621ffe24a0c3b29a0f17a02ce7412bb4d8fa7c5f7a710dca37871cee1e
[P1] Table 1 took 13.9997 sec
[P1] Table 2 took 117.349 sec, found 4294980832 matches
[P1] Table 3 took 141.059 sec, found 4294995955 matches
[P1] Table 4 took 169.916 sec, found 4295042754 matches
Copy to /Volumes/iron12a/plots/plot-k32-2021-06-25-10-43-98bd029991755df821977d6035bb3d6af9f2941ad55d078814c4f9bc56aa0d44.plot finished, took 607.015 sec, 170.984 MB/s avg.
[P1] Table 5 took 167.345 sec, found 4294939538 matches
[P1] Table 6 took 152.348 sec, found 4294904657 matches
[P1] Table 7 took 117.799 sec, found 4294863381 matches
Phase 1 took 879.828 sec
[P2] max_table_size = 4295042754
[P2] Table 7 scan took 5.83612 sec
[P2] Table 7 rewrite took 14.8941 sec, dropped 0 entries (0 %)
[P2] Table 6 scan took 29.0261 sec
[P2] Table 6 rewrite took 70.5404 sec, dropped 581259408 entries (13.5337 %)
[P2] Table 5 scan took 31.5426 sec
[P2] Table 5 rewrite took 58.7327 sec, dropped 761941780 entries (17.7405 %)
[P2] Table 4 scan took 35.3555 sec
[P2] Table 4 rewrite took 57.9204 sec, dropped 828877753 entries (19.2985 %)
[P2] Table 3 scan took 30.7595 sec
[P2] Table 3 rewrite took 57.9334 sec, dropped 855055143 entries (19.9082 %)
[P2] Table 2 scan took 32.7772 sec
[P2] Table 2 rewrite took 57.989 sec, dropped 865579297 entries (20.1533 %)
Phase 2 took 494.12 sec
Wrote plot header with 268 bytes
[P3-1] Table 2 took 37.3195 sec, wrote 3429401535 right entries
[P3-2] Table 2 took 29.0836 sec, wrote 3429401535 left entries, 3429401535 final
[P3-1] Table 3 took 43.0823 sec, wrote 3439940812 right entries
[P3-2] Table 3 took 29.2892 sec, wrote 3439940812 left entries, 3439940812 final
[P3-1] Table 4 took 45.2958 sec, wrote 3466165001 right entries
[P3-2] Table 4 took 29.6292 sec, wrote 3466165001 left entries, 3466165001 final
[P3-1] Table 5 took 43.0457 sec, wrote 3532997758 right entries
[P3-2] Table 5 took 30.3091 sec, wrote 3532997758 left entries, 3532997758 final
[P3-1] Table 6 took 45.386 sec, wrote 3713645249 right entries
[P3-2] Table 6 took 32.9202 sec, wrote 3713645249 left entries, 3713645249 final
[P3-1] Table 7 took 33.1275 sec, wrote 4294863381 right entries
[P3-2] Table 7 took 36.3604 sec, wrote 4294863381 left entries, 4294863381 final
Phase 3 took 437.56 sec, wrote 21877013736 entries to final plot
[P4] Starting to write C1 and C3 tables
[P4] Finished writing C1 and C3 tables
[P4] Writing C2 table
[P4] Finished writing C2 table
Phase 4 took 35.3326 sec, final plot size is 108834517748 bytes
Total plot creation time was 1846.88 sec (30.7814 min)
When it worked on my 5950x 128gb 3200 RAM on Clear Linux I got 20 minute 30 second times. But… I sometimes got errors which would cancel plotting or the box would freeze. Stability = king. I went back to the normal plotter.
I’ve gone at least that much time on regular plotter with no freezes or errors. All hardware is compatible, PBO and XMP are within normal range. System is up to date.
Bram Cohen mentioned they want to test on different hardware/software configs before merging it into regular plotter. I think that’s a great idea.
sometimes pushing your ram back helps with stability. im getting the same time as you from a r9 3950 and r9 3900 . Mine go from 20 to 24 min per plot in 100 plots, the more plots the slower…reset and its back to 20 min… im not even using fancy m.2 yet…but i am running ram disk and a lot of patients