Hi all, I’m fairly new but interesting in learning and making sure I can apply the knowledge. It’s my 2nd w/end attempting to plot but no success yet.
I have a TekQ Cube 500Gb SSD ThunderBolt 3 SSD. I’m 52hrs in but have only achieved 26% of plotting with the following settings:
1 plot
K32
Temp + Destination SSD
Threads: 16
c13Gb
I’m running this from a 2.3 GHz 8-Core Intel Core i9 with 16Gb
Last w/end I attempted 2 parallel plots on 2x TB SSD’s but Chia or machine crashed. Used defaults and didn’t tweak memory nor threads. Over 3.5 days I only got as far as 52% and 23%.
No I haven’t enabled trip and it appears to require a reboot anyway. Also can you select which drives to enable it from.
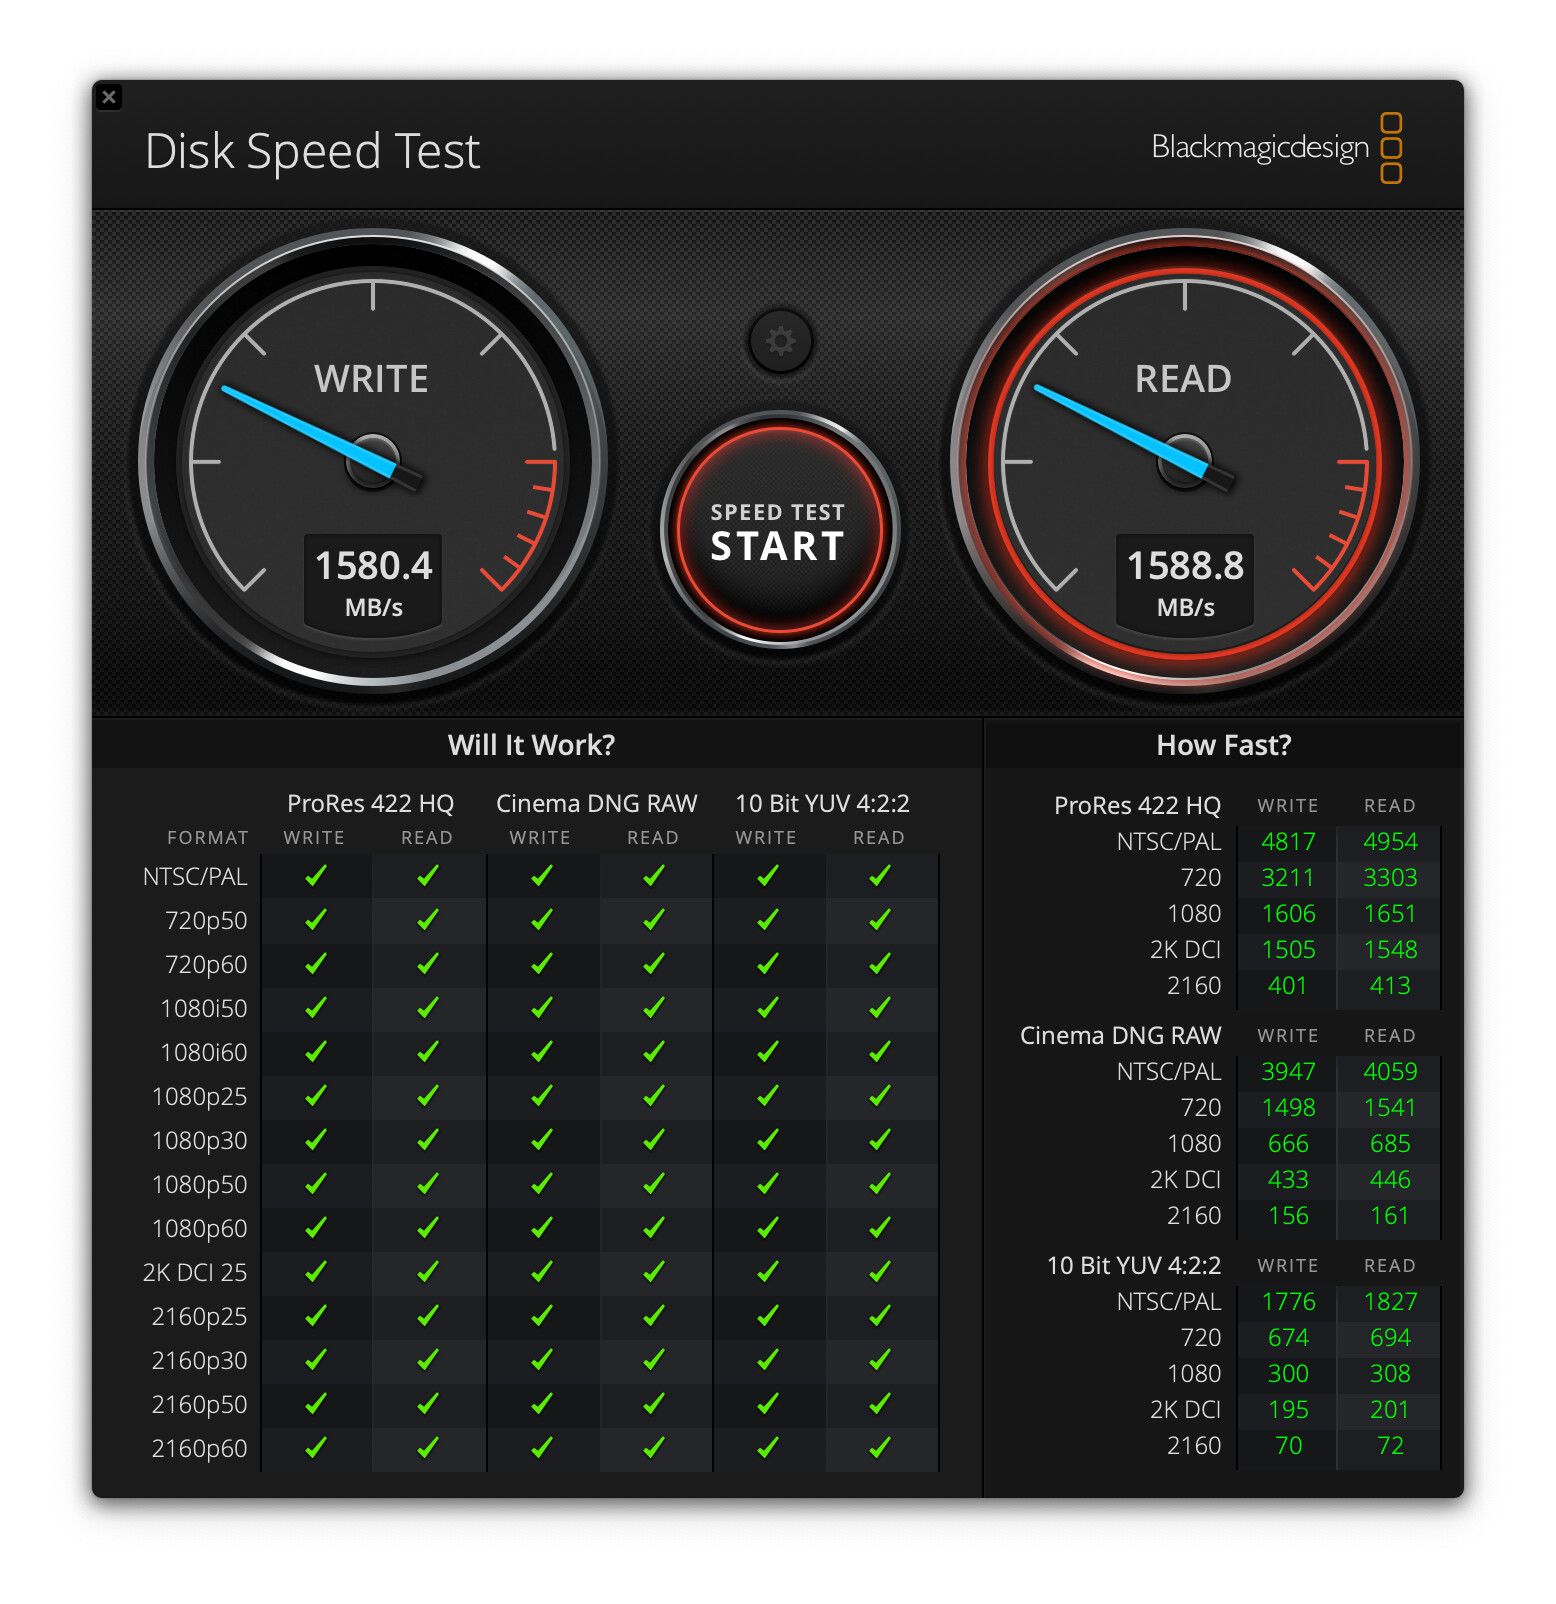
As for Disk xfer rates well Disk Speeds test does not let me as the SSD is readonly (strange, available space 367Gb).
Can you pause plot and pick-up later on?
Here is the log:
Only wrote 0 of 1048572 bytes at offset 74448612 to "/Volumes/TekQCube/Chia Plot 1/plot-k32-2021-05-15-12-22-bf39a2784b30aff4a1ba17aac32a35db38b3fcf70ea383bea50b4f47aab7b3e1.plot.p1.t2.sort_bucket_049.tmp"with length 74448612. Error 1. Retrying in five minutes.
Only wrote 0 of 1048572 bytes at offset 74448612 to "/Volumes/TekQCube/Chia Plot 1/plot-k32-2021-05-15-12-22-bf39a2784b30aff4a1ba17aac32a35db38b3fcf70ea383bea50b4f47aab7b3e1.plot.p1.t2.sort_bucket_049.tmp"with length 74448612. Error 1. Retrying in five minutes.
Oh your problem is that your disk is full. Or at least that is the message I’ve seen when it fills. If you make room on the disk it will try to resume. You mentioned it crashing before, did you delete all the temp files after the crash?
You can get a rough idea of your disk transfer rate by looking on the disk tab of the activity monitor. Filter for chia.
You can get a better view by using the iostat command in a command shell window.
iostat -c 20 diskX
This will give you 20 samples (default 1 sec) for the specified disk. The internal SSD is always disk0. Your external SSD will be one of 1–X. You can list multiple disk for monitoring.
Last time around I could see substantial amount of GB or TB’s written to disk via activity monitor by the python process but this time around I installed the native Mac installer dmg (needed to update anyway) and I’m only seeing 35Gb written by the chia process.
Also CPU is idling this time around:
bash-3.2$ time

real	0m0.001s
user	0m0.000s
sys	0m0.000s
Lastly the node status is Not Synced in case that affects plotting.
Hey man! Chia plotting is the great equalizer, it really pushes every system component to the limit! Are you familiar with memtest? Whenever strange phenomenon occur with plotting it’s often memory. Create a boot disk of this: https://www.memtest86.com/ and run it for a few hours to see if you get any errors!
It’s unlikely to be a memory issue as I push this machine quite a bit I should have noticed. Also it’s only a couple of months old. But let me try that.
Sorry I missed this earlier. You said the disk is read only. Any idea how that happened? That would explain the write failures. I’d guess there was an error writing to the drive that caused it to go read only. system logs might help finding it. Wild speculation, how hot did the external drive get when it was plotting? Plotting pushes drives hard, it’s a lot of writes for a long period of time. Maybe some type of thermal protection kicked in. How much experience do you have with this brand SSD?