Next measurement session
New hardware:
- i7-11700 8c/16t
- Asus Z590-F
- ADATA SX8200 PRO 1TB for the first temporary (tweaked XFS)
- ADATA SX8200 PRO 512GB for the second temporary (tweaked XFS)
- RAID0 of 4 x 4Tb
- RAM 32GB 3200MHs
- running on Fedora 34
- using optimized chiapos
Plotting parameters:
- Plot size is: 32
- Buffer size is: 28000MiB
- Using 128 buckets
- Using 2 threads of stripe size 65536
- Using optimized chiapos
Overall:
Time for phase 1 = 5074.508 seconds. CPU (162.030%)
Time for phase 2 = 2212.331 seconds. CPU (90.880%)
Time for phase 3 = 3109.913 seconds. CPU (139.740%)
Time for phase 4 = 284.687 seconds. CPU (102.400%)
Total time = 10681.442 seconds. CPU (139.220%)
Memory
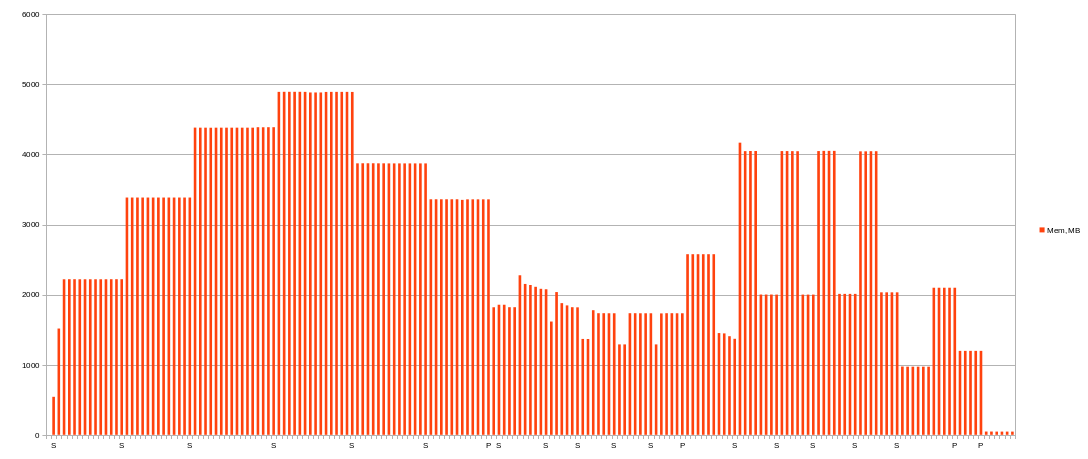
Only about 4892MiB was used of 28000MiB given for phase 1, 2276MiB at peak for phase 2, 4168MiB at peak for phase 3 and 1198MiB for phase 4.
So one plotting process (128 buckets, 2 threads) can utilize only 4892MiB of RAM (will try 4 threads and 64 buckets mixings later).
Disk space
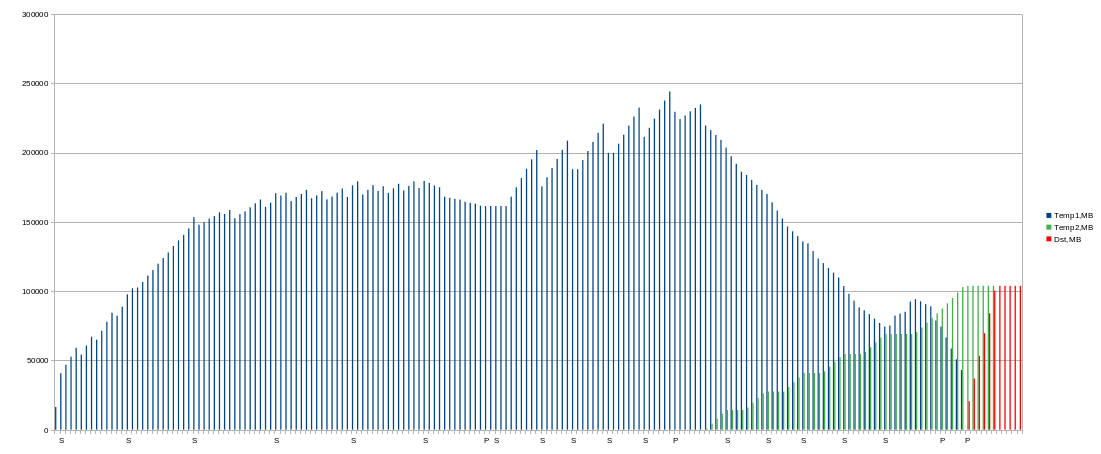
Looks like previous experiments, but peak usage is a little bit lower (244091MiB). I think it affected by higher memory usage.
CPU & IO
Note: next charts shows average values per minute! In moment them could be higher.
CPU usage:

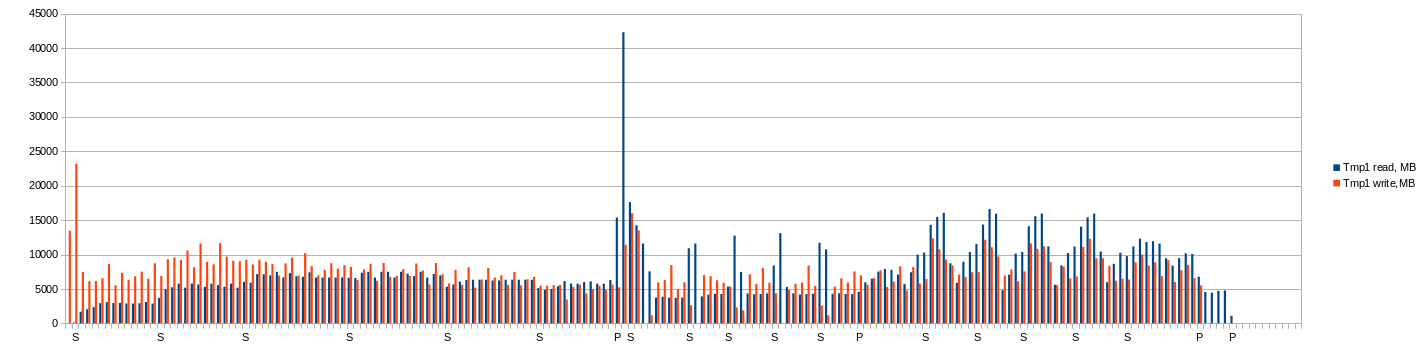
Total MB read and write on first temporary per minute (second and dest is not so interesting):
IOPS average (average per minute!):
