Plotting time too big with Madmax, Ubunto 20.04

Hello,
I am a noob in Ubunto and i am trying to plot.
My machine is: Ryzen9 3900, Ram 64GB 2600 , 2 x 2TB Gen 3 SSD m2.
I am coming from Windows where i am plotting with 40min /plot

I have copied the same MAdmax setting in Ubunto as follows:
-n 2 -r 12 -K 2 -v 256 -u 512 -t /media/ssd1 -d /media/ssd2 -f xxxxxxxx -c xxxxxxxxxxxxxxx

As a result i am getting 130min/plot which is not normal.

Ubunto is recently updated.
MadMax version: madMAx43v3r
These two also are installed:
cmake (>=3.14)
libsodium-dev
But no other settings have been made.

Please advice?

Could be a trim issue on the ssd

Windows its standard, ubunto not always.

Try using f2fs as file system for the ssdā€™s. This has trim by default and is meant for ssd

sudo apt install f2fs-tools

Then in disk manager format the drive, you can select ā€œother optionsā€ and then f2fs

1 Like

I would add some more on the -r, like 18 or 20 to see what it does.
Next step might be to use XFS, that helped me a great deal. And trim as said above!

Hello,
I have done that and here is the result:

Network Port: 8444
Final Directory: /media/ssd1/
Number of Plots: 2
Crafting plot 1 out of 2
Process ID: 18847
Number of Threads: 12
Number of Buckets P1: 2^9 (512)
Number of Buckets P3+P4: 2^8 (256)
Pool Puzzle Hash: xxxxxxxxx
Farmer Public Key: xxxxxxxxxx
Working Directory: /media/ssd2/
Working Directory 2: /media/ssd2/
Plot Name: plot-k32-2021-09-18-20-41-9568b72f0b72c7ea2f3ea763ad05fcdf1854698e5a7f184bfb397a367377ebdb
[P1] Table 1 took 16.0261 sec
[P1] Table 2 took 144.584 sec, found 4294856035 matches
[P1] Table 3 took 288.771 sec, found 4294611602 matches
[P1] Table 4 took 688.504 sec, found 4294262083 matches
[P1] Table 5 took 620.27 sec, found 4293503364 matches
[P1] Table 6 took 543.606 sec, found 4292078404 matches
[P1] Table 7 took 375.019 sec, found 4289154088 matches
Phase 1 took 2678.31 sec
[P2] max_table_size = 4294967296
[P2] Table 7 scan took 56.7895 sec
[P2] Table 7 rewrite took 69.835 sec, dropped 0 entries (0 %)
[P2] Table 6 scan took 38.1722 sec
[P2] Table 6 rewrite took 54.8547 sec, dropped 581677952 entries (13.5524 %)
[P2] Table 5 scan took 34.7723 sec
[P2] Table 5 rewrite took 51.8491 sec, dropped 762383150 entries (17.7567 %)
[P2] Table 4 scan took 38.7738 sec
[P2] Table 4 rewrite took 51.3847 sec, dropped 829232452 entries (19.3102 %)
[P2] Table 3 scan took 35.7676 sec
[P2] Table 3 rewrite took 50.1169 sec, dropped 855332910 entries (19.9164 %)
[P2] Table 2 scan took 41.9776 sec
[P2] Table 2 rewrite took 49.6951 sec, dropped 865766551 entries (20.1582 %)
Phase 2 took 592.2 sec
Wrote plot header with 252 bytes
[P3-1] Table 2 took 77.6019 sec, wrote 3429089484 right entries
[P3-2] Table 2 took 28.4758 sec, wrote 3429089484 left entries, 3429089484 final
[P3-1] Table 3 took 123.464 sec, wrote 3439278692 right entries
[P3-2] Table 3 took 47.2728 sec, wrote 3439278692 left entries, 3439278692 final
[P3-1] Table 4 took 235.053 sec, wrote 3465029631 right entries
[P3-2] Table 4 took 47.5663 sec, wrote 3465029631 left entries, 3465029631 final
[P3-1] Table 5 took 232.894 sec, wrote 3531120214 right entries
[P3-2] Table 5 took 87.8085 sec, wrote 3531120214 left entries, 3531120214 final
[P3-1] Table 6 took 242.788 sec, wrote 3710400452 right entries
[P3-2] Table 6 took 100.207 sec, wrote 3710400452 left entries, 3710400452 final
[P3-1] Table 7 took 292.132 sec, wrote 4289154088 right entries
[P3-2] Table 7 took 69.3724 sec, wrote 4289154088 left entries, 4289154088 final
Phase 3 took 1592.25 sec, wrote 21864072561 entries to final plot
[P4] Starting to write C1 and C3 tables
[P4] Finished writing C1 and C3 tables
[P4] Writing C2 table
[P4] Finished writing C2 table
Phase 4 took 55.906 sec, final plot size is 108756553800 bytes
Total plot creation time was 4918.73 sec (81.9788 min)

Better, but still a way above windows(40min).

What is the brand of your NVMes?

Since your CPU has 12 physical / 24 logical cores, and looks like you dedicated that box to MadMax, you may want to set -r value to 24 or 25. I donā€™t think that MM is really respecting those values (i.e., grabs more logical cores than it is specified), but an explicit selection usually helps a bit in case it hesitates.

I think that you made a mistake, and specified both t1 and t2 to be /media/ss2. This may be the biggest slowdown.

I would also start with both -v and -u be 256 (or what looks nicer - 8).

I am not sure, but I think that the value:

[P1] Table 1 took 16.0261 sec

more or less represents pure CPU capabilities (and it is in a good range). However,

Phase 1 took 2678.31 sec

shows temp2 performance and it is slow. During that phase t1 is not that much used, but still may be slowing down t2, as in that run they are the same.

Also, the fourth phase:

Phase 4 took 55.906 sec

reflects mostly temp1 performance, and it is in a good range.

Also, depending how many plots you would like to get at the end of the day, I would suggest to upgrade your RAM to 128 using it as temp2, and run your NVMes in RAID0 as temp1. MM is not using that much RAM by itself, so anything above 16GB is not needed. Although, if you have 64, in Windows you can use PrimoCache and ask it to never write data to SSDs, what is a good use of your RAM above that 16 GB and saves your NVMes a little. With 128 GB, you donā€™t need PrimoCache, as you will use 110 GB RAM drive for t2 (saves you about 75% on life span of your NVMes) - this applies to both Win and Linux.

Update:
Sorry, I misread your MM command. You have plenty of room on your NVMes, so there is no need to specify just one as a working one, but the other as pure destination. You really slow down the working one, but underuse the destination. I would suggest that you run it like:

-n 2 -r 24 -v 8 -u 8 -t /media/ssd1/tmp -2 /media/ssd2/tmp -d /media/ssd1/xfr -f xxxxxxxx -c xxxxxxxxxxxxxxx

You can store about 15 final plots on ssd1 before MM will start barfing. I assume that you still need to xfr those plots to some destination HD, though (manually or via some script), and that will keep your MM running.

If for now you want to run MM as in that line I gave you, you may also use -G flag. That will balance t1 and t2 SSDs, so they will be wearing off at the same rate.

By the way, if your box is just setup to plot, upgrade to Ubuntu 21.04. Unless you have some specific needs, there is no point to stick with 20.04.

How does that compare speed wise?

In my experience, there is no speed advantage (of course, unless your SSD suck), you just save about 50% of writes to tmp2 folder. That was on Intel i9-10900 with 64 GB DDR4 3200, and Samsung 970 NVMe.

But, you need to ask PrimoCache to never write. What it means is that it keeps whatever it can, and let go everything else. If you just use some timeout (defaults), it starts juggling with new writes, and you donā€™t save that much.

1 Like

Hi, my SSD brand is: Crucial P5 , 2 TB Solid State Drive

That is a good one.

It is post mortem for you, but here is a very good video that may help to decide which NVMe to purchase:

In that video description are the links to all relevant sources, so anyone can dig in to re-interpret the data. It was surprising to me that Samsung 970 was in the top three, almost next to its brother 980 Pro. 970 is PCIe 3, where 980 Pro is PCIe 4. Maybe they used an old Intel box that only has PCIe 3 interface.

As mentioned, I run Samsung 970 and WDC Black SN750 (both in 1 TB sizes). I cannot say that I see much difference, other than Samsung is running too hot, so those need extra cooling (a heatsink, and a slow 40-60mm fan will do). Although, seeing some recent chip replacements in those NVMes, I would not buy WDC anymore - not that Samsung didnā€™t do it, but ā€¦).

1 Like

Sounds right. For MM mostly, I have used both 1tb 980 Pro and 970 Evo Plus (not Pro) in a PCI-e 4.0 MB. The 980 Pro is faster plotting by a bit, but the 970 E+ is pretty close, esp. considering itā€™s only PCI-e 3.0. Itā€™s a workhorse, doesnā€™t slow down. I disagree with his advice not to buy the 980 Pro, however. Heā€™s going off from specs alone, not real world use. Mine has 770tb written, spec is only 600tb, yet in Magician, drive health shows as ā€˜Goodā€™. So weā€™ll see if and when it dies.

Thatā€™s the reason I said to re-interpret that data. There is no one ā€œthe bestā€ solution, as boxes that we have differ, our budgets differ, the number of plots we want to make differ, ā€¦ Overall, it is a very good starting point video, better than just blindly following one guy like you or me.

You need to be careful with when you will get the PCIe 4 benefits.

First is the CPU, where mine is i9-10900, and it only supports PCIe 3, even if it is put in 5xx based mb (5xx chipset is PCIe 4 compatible).

The second is how your PCIe lines are being handled. Again, on my mb (Z490), only one NVMe slot is directly connected to the CPU, all other slots are being shared (my understanding is that this is not the case on AMD motherboards). It doesnā€™t matter for a single NVMe, but it can make having OS based NVMe RAID0 kind of worthless.

No worries: ThreadRipper Pro
Gen 4 support for PCIe slots
and M.2 storage
(2) PCIe 4.0 nvme on MB
(4) PCIe 4.0 x16 Gen 4
(2) PCIe 4.0 x8 Gen 4
also: Gigabyte Gen 4 nvme x 4 AIC

1 Like

Of course you are 100% correct my friend. And exactly the reason I broke down and got the TR for plotting ā€¦ is just because of what you mention. Itā€™s a minefield deciphering what slots get what supportā€¦ PCI-E 3 vs 4, how many lanes get to what, if at all, etc. I got totally frustrated with an AMD B550 MB as it has two nvmes on board, but using them severely limited what slots would support, or even work. Fortunately TR eliminates all that with flying colors. Everything you want and need, and no bull$hit specs changing dependingā€¦ :laughing:

1 Like

Cool!

Unfortunately, (consumer) Intel rather suck (comparing to AMD) Although, for the sake of that, I built a box around Dell T7610 with two Xeon E5 2695 (12 cores each, manufactured in 2012/2013). I gave each CPU 128 GB 1866 MHz DDR3 RAM, and each one Samsung 970 Pro+ NVMe, and am getting combined ~20 min plotting times (two MM instances running in parallel, each taking ~40 mins). And I think I can still push it a bit more. That box beats that i9-10900 (10 cores) hands down, both with speed and cost. (If not NVMes, it is well under $1,000 box. Although, if not that I already had those NVMes, I would go with 8x SAS3 RAID0, and that would still fit under that $1k.)

I got 28 minute plots on Ryzen 3950X using Intel P4500/P4600 SSDā€™s as my temp1 and temp2 (respectively) for mad max in Ubuntu

My settings were something like -r 15 -K 2 and I had buckets set to 512

you do not need to buy fancy expensive SSDā€™s to get good plot speeds. You dont even need PCIe 4. Something else is wrong on your system.

Are your SSDā€™s formatted EXT4 for Linux?

Hi,
i have in tot 3 SSD.

  1. Slow SSD 512gb - NTFS - Only Linux is installed.
  2. Plotting SSD 1 - 2 TB, Crucial P5 - FTFS
  3. Plotting SSD 2 - 2 TB, Crucial P5 - FTFS

Hello,
I got an upgrade and now my machine looks like this:
My machine is: Ryzen9 3900, Ram 128GB 2600 , WD_BLACK SN850, 500gb SSD m2.
PBO is activated in the BIOS.
Ubunto is upgaded to 21.04.
MadMax version: madMAx43v3r
The SSD if formated to F2FS.
Ram disk of 110Gb is made.
These two also are installed:
cmake (>=3.14)
libsodium-dev
But no other settings have been made.

I have tried with the following MAdmax setting in Ubunto as follows:
-n 2 -K 2 -r 12 -u 256 -v 512 -t /media/lubo/ssd/ -2 /mnt/ram/ā€¦
ā€¦and got 28 min/plot.

Please advice can i fine tune this so i can get better times?

Target is 22 min/plot.

Many thanks,

1 Like

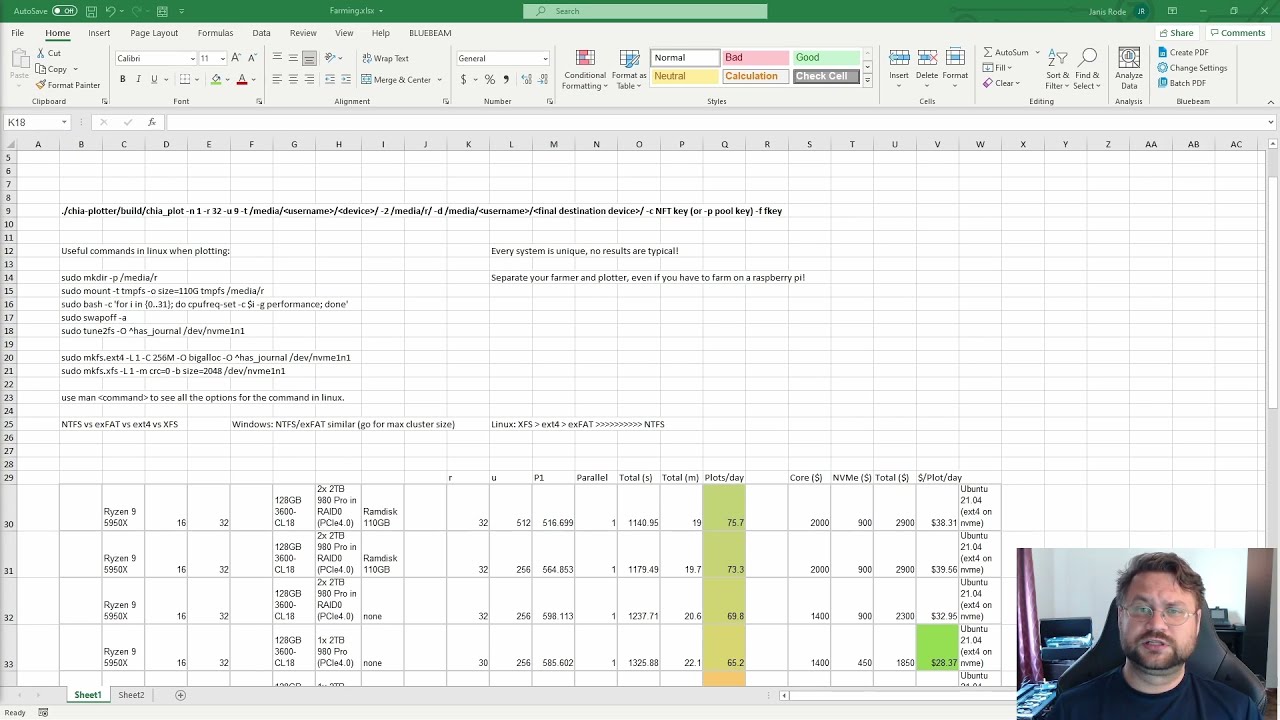
Janis Rode has excellent videos about fine tuning AMD boxes. For instance:

Hi,
Thanks of this Video. Very helpful.
Unfortunatelly, i gain no benefit of all this settings.

Still 28min/plot.

Maybe the RAM speed is crucial here, my is only 2600mhz.