RAID0 Server Plotting Hangs (Linux CLI)

I have got a new (used) R620. T dir two SAS Drives Raid0, 2 dir 4 SASDrives Radi0. 96GB Ram.

OS Drive NVMe (using clover Bootloader to load drivers since Dell Bios doesn’t have them)

Ubuntu with Chia CLI, madmax. Running in Virtual Env on tmux session.

Seems to hang at [P1] Table 2, 6% consistently.

chia plotters madmax -k 32 -n 10 -t </RAID02Disks> -2 <RAID04Disks> -d <RAID04Disks/destination> -w -c blahblah -f blahblah

Instead of using chia provided MM, I would rather download MM from his github site - GitHub - madMAx43v3r/chia-plotter (what I do).

I have t7610 with a couple of e5 v2 CPUs (what your box also has), but I run two MM instances, one per CPU.

Your first problem is with that “p1 Table 1 took 200s” It should take somewhere around 10 secs for that table. Therefore, something is horribly wrong with your setup.

Try to run one instance with something like that:

$PLOTTER -n 1 -k32 -r NUMBER_OF_PHYS_CORES_ON_1_CPU -K 2 -u 8 -v 8 -t $DIR_T1 -2 $DIR_T2 -d $DIR_DST -p $POOL_KEY -f $FARMER_KEY`

SAS drives in RAID0 configuration are staring to make sense, if you have 8+ for one array. Having just 2 is really too slow. Maybe this is the problem, at least it is potentially a big part of the problem for your setup.

Also, your box supports up to 768 GB, so why don’t you upgrade it at least to 128 GB to use 110 GB for -t2. That will speed up substantially your plotting times.

Depending how many plots you want to make, you may want to purchase enough RAM to plot completely in RAM (256 GB per instance for MM), or get an NVMe for t1. Also, upgrading RAM to 512 GB and running BB RAM is an option. (On my box (with 512 GB RAM) 2 MM instances are about as fast as BB). It also looks like Ubuntu has the slowest plot times (whether for MM or BB) by about 10-20% (comparing to Debian or Rocky/CentOS).

You can potentially buy 32 GB RAM DDR3 1866 sticks for ~$15-20 on eBay.

By the way, install psensor, and monitor your CPU and RAM temps. I had to add AIOs to both of my CPUs and add extra fans to cool down RAM. If not that, the box was temp throttling.

2 Likes

All good tips thanks. I’m aware of most of these, and had ordered some RAM already.

But with the issue at hand… I had tried to use the native MM plotter but it just builds the binaries… and then what? Do I copy them to the main Chia Dir? Or can I run them standalone? Are you saying the main chia implementation, with MM is borked?

Would love to get plotting while I wait for the RAM. Gut feel is current raid configuration shouldn’t fail. Even if it plots slowly. I have had an older Dell Server doing the same (see my old post) with plots taking just a couple of hours.

1 Like

You don’t need chia to run MM. You only need your f/c/p keys. So, when you build it, you can move around that binary to whatever place it is convenient for you.

I am not saying that MM provided by chia is borked, rather that I have basically zero confidence in chia providing sound / tested code. Also, I see no reason to install chia, if MM works by itself. All eventual MM updates will end up in MM github one, maybe not or late in chia. Saying that, I have never had a need to run MM they provide.

For time being, I would just make one RAID0 array with as many SAS drives you have / can connect to your box and would not use t2 (for now). RAID0 with 2 SAS drives is really slow, so combining those two RAIDs into just one may (or may not to) provide a small improvements.

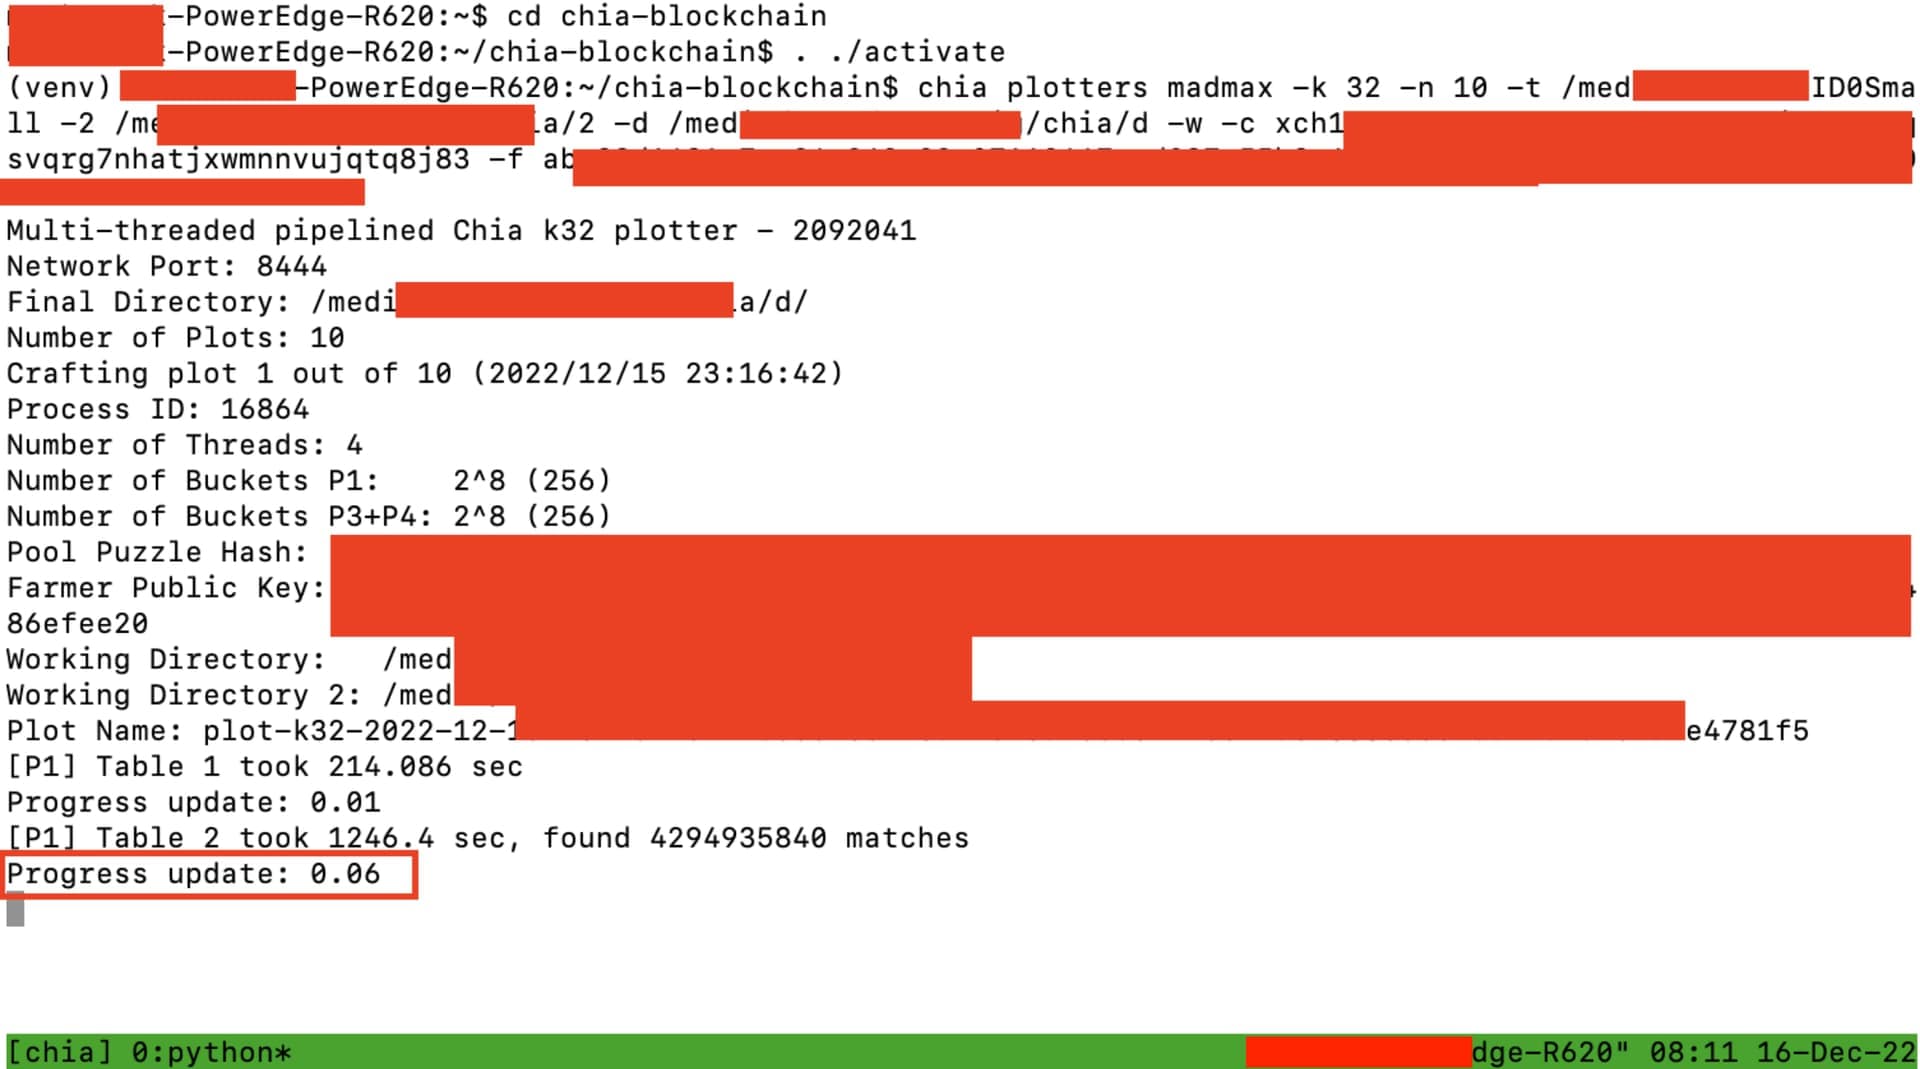
What you posted (200 sec for Table 1) is 20x slower than one instance on my box. Sure, I have 2695 v2 with 12 phys cores, and I run MM completely from RAM. If you control your box, you should see about 30-35 mins / instance for k32 plots (making all possible upgrades).

Just to get it going, I would avoid using for time being virtualization, and potentially disable the second CPU. MM may have problems with spanning across 2 CPUs (thus NUMAclt is needed).

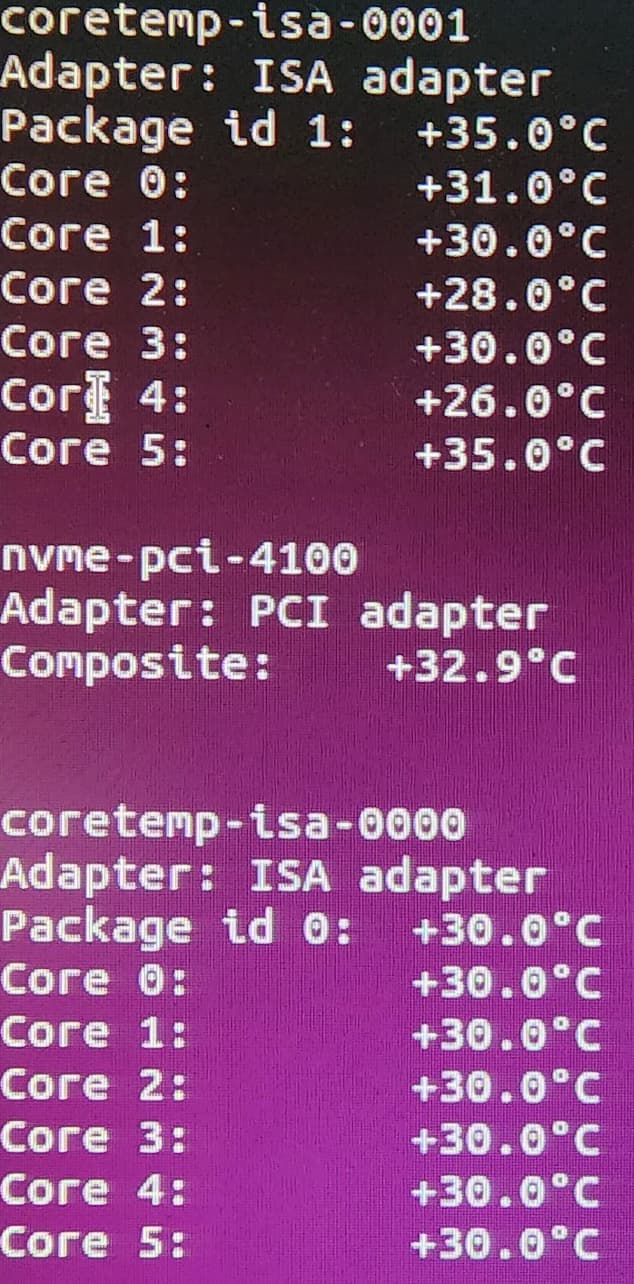
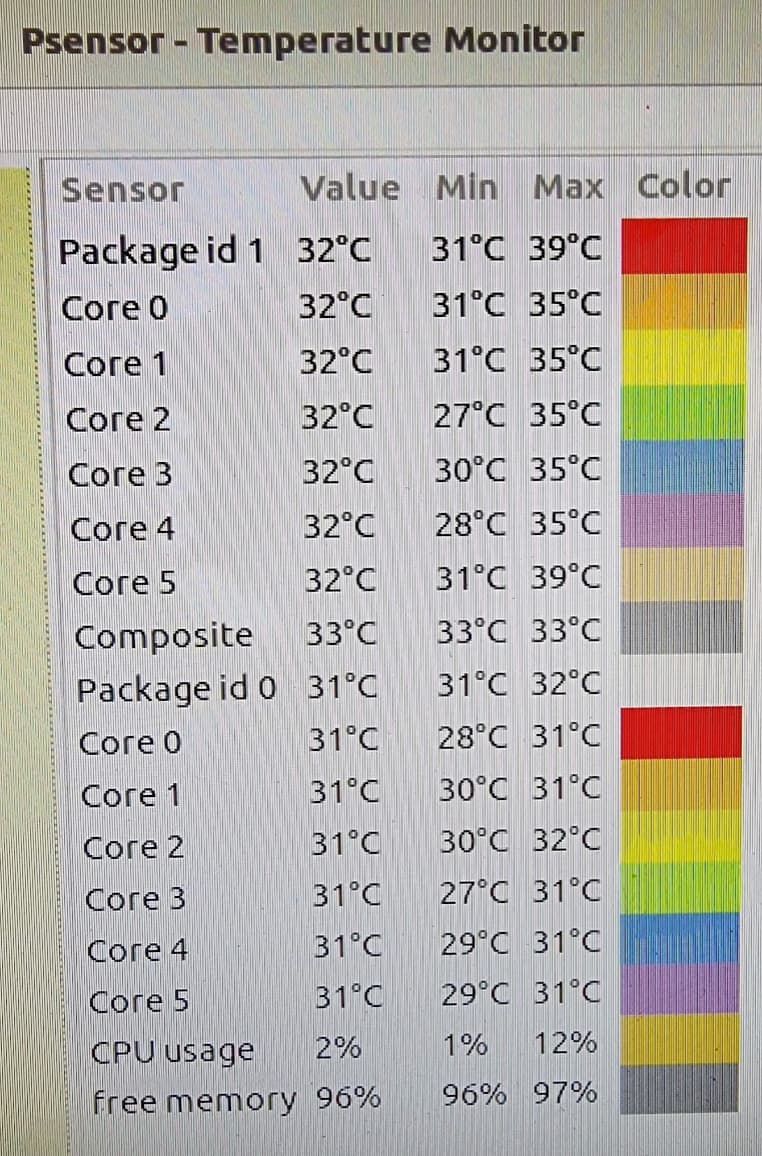
What results you have from hdparm when testing your RAID arrays? Plese, provide a snapshot of resource monitor with both screens: CPU (middle) and processes (left), where write speeds are visible. Also, run sensors, and provide output here.

Actually, have you checked either message / syslog or journalctl for potential warnings / errors?

You can also install bpytop, as it gives more info (e.g., CPU / core temps, disk IO, …).

1 Like

Any instruction (link) on how to do NUMA mad max? I will buy a T7610 or HP Z820. Thanks!

My crippled dual CPU machines, HP Z620 is stably running now. Dual E5 2660V2, 192 GB ram. MM in ubuntu. 33 minutes a plot. Must add -w but I made a RAIO 0 as target drive. Copy to RAID 0 is pretty fast. Adding -w makes it very stable 33 minutes a plot. Thanks for all the help in the past.

1 Like
numactl --cpunodebind=0 --membind=0 -- mount -t tmpfs -o size=${TMP_RAM} tmpfs /mnt/ram1/
numactl --cpunodebind=1 --membind=1 -- mount -t tmpfs -o size=${TMP_RAM} tmpfs /mnt/ram2/

numactl --cpunodebind=0 --membind=0 -- $PLOTTER1 ... /mnt/ram1 ...
numactl --cpunodebind=1 --membind=1 -- $PLOTTER2 ... /mnt/ram2 ...

Also, when using NUMA, you need to check your BIOS how it handles it.

I would not be buying any new plotter right now. Max is due to publish his MM v2 that most likely will be GPU assisted (hopefully). This will shift plotting burden off the CPUs (hopefully). Also, compressed plots are around the corner, so whatever you plot now, you may / will need to replot in a couple of months or so.

1 Like

Yikes re not buying mining rigs :frowning:

Things have gone from bad to worse for me. My fans inexplicably are now stuck on high. It’s too loud to be next to.

I reset my bios and removed all USB/PCI cards (a baseline state where it wasn’t doing this), and it continues. Googling suggests a few things… none of which have worked so far.

I can’t find anything in BIOS or iDRAC settings that would attenuate this.

Potentially fan speeds are just a secondary thing to your CPU temps (you may be fighting manifestation, not really the cause). I would focus on understanding temps first.

What sensors tell you? Install bpytop, as it may also shows CPU/core temps (I think it is using lm_sensors, so should / may be the same as sensors output).

I am not sure what iDRAC is, but most likely equivalent to IPMI. My understanding is that when you reset the BIOS, the IPMI (thus iDRAC) may not be affected. Maybe you can check there what is the fans speed response curve with regards to temps.

As mentioned, I switched to AIOs, as stock heatsinks were basically worthless for such CPU loads. You have around 400 W generated by those two CPUs that need to be somehow removed from the case.

By the way. Those boxes are old, so maybe part of the problem is that the thermal paste shrunk / solidified already. I would buy a good thermal paste, clean your CPUs / heatsinks and repaste them.

Great ideas again. Just redid the thermal paste on my NAS so I’m all set up with what I need and will have a go on the server. I could also give it more of an air gap in the rack.

By the way, maybe you can check your iDRAC to see which sensor is triggering those fans? That may offer some clues.

My RAM arrived and I have 128 GB so plotting with T2 as a 110GB RAM disk. And an 8 drive RAID Zero as T1. It’s running much quicker. I’m also using MM natively.

As for the fans I can’t figure it out. All cooling is working everything reset and no CPU over ~40C

2 Likes

hmmm

[P1] Table 1 took 58.6755 sec
[P1] Table 2 took 303.768 sec, found 4294963392 matches
[P1] Table 3 took 308.752 sec, found 4295020456 matches
[P1] Table 4 took 362.154 sec, found 4294960430 matches
[P1] Table 5 took 347.066 sec, found 4294965573 matches
[P1] Table 6 took 399.418 sec, found 4294985909 matches
terminate called after throwing an instance of ‘std::runtime_error’
what(): fopen() failed with: Read-only file system

real quick
stop using raid for plot storage
please dont make me explain why and just trust me.

if you want faster plot speeds you need a better ssd just in general
with 24 cores and a single nvme samsung 980 pro is about as good as it gets with less than a hour plot times…

i belive a system specked any higher is just beyond reson and should be put into a class of thier own… but even still spending thousands on plotting equipment wont automagicly make ur plotting faster

use madmax

raiding 0 2 drives together vs plotting to a single show neglagable returns in my testing

1 Like

Looks like you are making some progress. I saw some people reporting that RAID0 based on 8+ SAS drives has speeds comparable to NVMe, so should be really fast.

My understanding is that those CPU temps are reflecting idle time. The difference between min/max is just too small for a working MM process. Although, maybe your CPU is still somehow bogged down with IO waits, so basically mostly sits idle waiting for either RAM or RAID0 access. Still, I would expect bigger temp diffs. Also, Psensor shows that the max CPU usage was just 12%, so that really indicates an idle box.

On that Psensor app, you can enable selective charting to the right of those colored rectangles. Go with Package id 0/1 as those show overall CPU temp. Also, on the Settings tab, extend your sampling cycle to 20 mins for now (to cover your Phase 1).

Also, get a screenshot of your resource monitor (CPU usage). Also, slower the sampling rate to 5-10 secs or so. That will show whether CPU is sitting idle, and how much.

Yeah, not much info in that exception report. The only thing for now to go after is that “failed with: Read-only file system.” If that exception output is real it may indicate that one of your folders doesn’t have proper privileges to write to it (for the user running MM). Maybe run “ls -la t1, t2, dst” and post the results for that folder (the “.” is of concern). Maybe when you mounted one of those, you run sudo, and one of those folders has just root privileges. Maybe also run “df -h” just to make sure all folders have enough space. (Although, it is kind of strange that those 6 tables finished without a problem, as I assume during that time there are writes to both t1 and t2, maybe not.)

Actually, could you show the cmd line for those results? I still suspect that running just one MM instance across two CPUs may not be the best option.

Before I check the other stuff… yes it was idle temps. Point being the server sounds like a jet engine at idle. It’s so loud I need ear plugs to stand near it to configure it. Then there are long boot times (normal for a server I know), which makes it untenable to be near, trouble shooting for hours on end. You can hear the damn thing from my neighbours house! I can SSH in of course, but that’s useless for playing with BIOS.

It wasn’t doing this before and I have reversed every single change except rolling back iDRAC versions, which I’ll try next. But I’m loosing hope of ever getting this thing quiet again.

Re: fan speed: You need to get on your iDRAC and figure out which temp sensor is being tripped. Maybe this way you can unblock the offending part, or if not kill that sensor (remove from being a trigger). Actually, in my server (not the plotter), the PSU fan was the offending one. I drilled a 80mm hole next to the intake and added 80mm fan to push fresh air. Otherwise, it was getting already warm air from HDs. The fact that your CPUs are around 30 deg would imply that the trigger is not coming from CPU / motherboard sensor, but something else (PSU, GPU, ???), or maybe some sensor is busted. Maybe one of the fans is bad, and I think the default action for all the other fans would be to go full speed to compensate for it (regardless of whether it is needed or not).

Re: noise: Install xRDP, so you can do everything (except BIOS) from your normal box. It is a simple install. The BIOS in my t7610 also takes really long to go through, so this part really sucks.

One more (temporary) option is to open the box and put a hardware store 20" fan or so on the top of it and kill those offending fans. The motherboard should also have additional fan headers (but Dell version, so conversion cable is needed), so you could later install different fans.

1 Like

@Jacek - Happy days. I am plotting.

Topped up the RAM to 128GB for T2. T1 is a 5 disk RAID0 SAS 10K (lost a drive but will add 3 more)

Getting 55min plots with 16 threads.

I fixed the fans. One of the iDRAC upgrades defaulted to very aggressive temp management. I reconfigured defaults under a Temp menu that was hidden in an area where I didn’t know more options were available by scrolling. It runs whisper quiet and CPUs get up to peak 70 deg C. Which I think is a bit too high. The fans should be kicking in earlier. I know fan control works because they go hard on boot and (very) occasionally during plotting.

Will keep tweaking. Thanks again for your help. Very much appreciated.

1 Like

Great that you got it going. Nice charts!

I also hide those "Core X’ sensors, as overall they bring not much, but clutter that part. Also, on my box (t7610) I have a couple of RAM temp sensors. Maybe you could try to see whether that is available on your box. I had to add extra fans to bring RAM temps down.

Not sure what is your sampling rate, but I try to get both of those charts to cover one plot run. (Analog display is faster to read than digital especially when looking for anomalies; as that PSensor have digital on the right side, so the data is there, just slower to pick up outliers.)

On that Resources app, if you go to Processes, you can check your RAID speeds (far right columns). You can try to roughly check your gains when you add more those SAS drives. It is a bummer that it is not included on the chart panel, and that no one wrote an app similar to PSensors that would show such charts (Grafana time).