It would indeed be nice if the console plot output showed percent complete, or estimated time to completion. Right now it does not, however, you can break down where you are in the process by reading the console output and scrolling back a bit.
Here’s my attempt to summarize and breakdown where you are in plotting by reading the console output.
2 Likes
PHASE 1 (6503 sec, 1:48:23)
COMPUTING table 1 (bucket 0-127 uniform sort)
COMPUTING table 2 (bucket 0-127 uniform sort)
COMPUTING table 3 (bucket 0-127 uniform sort)
COMPUTING table 4 (bucket 0-127 uniform sort)
COMPUTING table 5 (bucket 0-127 uniform sort)
COMPUTING table 6 (bucket 0-127 uniform sort)
COMPUTING table 7 (bucket 0-127 uniform sort)
PHASE 2 (3460 sec, 0:57:40)
BACKPROPAGATING table 7 (scan, sort)
BACKPROPAGATING table 6 (scan, sort)
BACKPROPAGATING table 5 (scan, sort)
BACKPROPAGATING table 4 (scan, sort)
BACKPROPAGATING table 3 (scan, sort)
BACKPROPAGATING table 2 (scan, sort)
PHASE 3 (7014 sec, 1:56:54)
COMPRESSING tables 1 and 2 (bucket 0-101 uniform sort, bucket 102 QS)
COMPRESSING tables 2 and 3
COMPRESSING tables 3 and 4
COMPRESSING tables 4 and 5
COMPRESSING tables 5 and 6
COMPRESSING tables 6 and 7
PHASE 4 (580 sec, 9:40)
WRITING C1 and C3 tables
Bucket 0-127 uniform sort

WRITING C2 TABLE (P1, P2, P3, P4, P5, P6, P7, C1, C2, C3)

FINAL FILE SIZE {x} GiB
TOTAL TIME = {x} seconds. (17559 sec, 4:52:39)
COPY
copy final file from plotting dir *.plot.2.tmp to final dir *.plot.2.tmp
remove temp2 file from plotting dir *.plot.2.tmp
rename final dir file from *.plot.2.tmp to *.plot
This data is from 1.0.4 of the plotter, so I think it should be proportionately correct with the current plotter.
1 Like
Which one of these phases is writing temp files? Trying to see if there is clean separation of CPU vs I/O bound parts of the process other than phase 4.
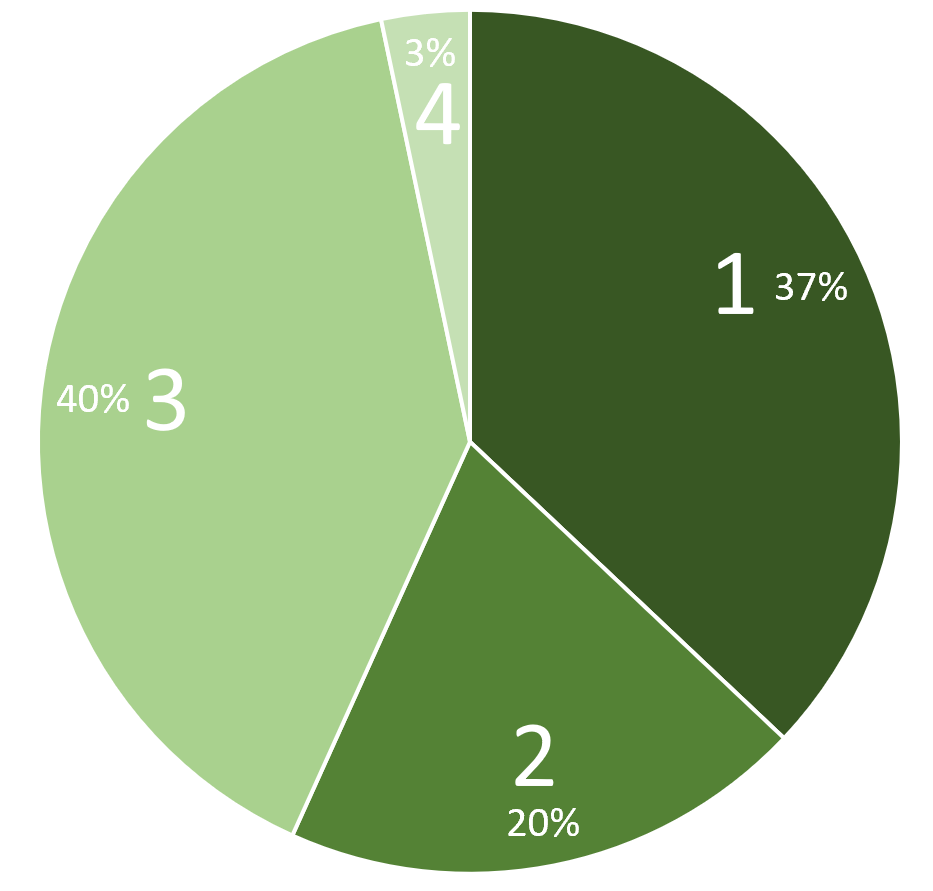
Here’s a pie chart of the phase data above.
Read from top clockwise  , phase 1 → 2 → 3 → 4.
So if you see in the console…
Starting Phase 1 → 0% complete
Starting Phase 2 → 37% complete
Starting Phase 3 → 57% complete
Starting Phase 4 → 97% complete
I tend to kill off plots if they aren’t at least in Phase 3 when I need to shut things down. I need to be a bit more granular, so let’s see…
Phase 1 (0%)
- Computing table 1 → 1%
- Computing table 2 → 6%
- Computing table 3 → 12%
- Computing table 4 → 17%
- Computing table 5 → 22%
- Computing table 6 → 27%
- Computing table 7 → 33%
Phase 2 (37%)
- Backpropagating table 7 → 37%
- Backpropagating table 6 → 40%
- Backpropagating table 5 → 44%
- Backpropagating table 4 → 47%
- Backpropagating table 3 → 50%
- Backpropagating table 2 → 54%
Phase 3 (57%)
- Compressing tables 1 and 2 → 57% complete
- Compressing tables 2 and 3 → 64% complete
- Compressing tables 3 and 4 → 70% complete
- Compressing tables 4 and 5 → 77% complete
- Compressing tables 5 and 6 → 83% complete
- Compressing tables 6 and 7 → 90% complete
Phase 4 (97%)
- bucket 0 → 97%
- bucket 50 → 98%
- bucket 100 → 99%
- bucket 127 → 100%
OK. The above is accurate. I’m happy with it  … this is how you read the console and know what percent complete you are.
Multiply that percent by the actual plot time on the live system – bear in mind that plot time will change as you load the system; a benchmark of a single plot does not necessarily represent live parallel plot time – and you can estimate time to completion.
5 Likes