Hi @eve_collins i have similar setup as you, but have only 1tb samsung 980 and after update to 1.1.3 my ploting time from 5.5 per plot (3 plots i parrarel) was growth to 8h per plot
but you have insane time with one plot. Check If you have enabled triming and your disck have discard option
Are you running anything else on this machine? The 100% used SWAP seems disturbing. If you are actively swapping the plotting processes this could explain your problem. How is this measured?
If you are going to use the -2 option I would suggest making it the same as the -d option. This will avoid a copy from the -2 location to the -d location.
Nope. This machine has Ubuntu Desktop (20.04 LTS) running plotting and gui full node with farming (I know the latter is not ideal, and I was planning to move it over to another machine, but decided to keep it here for now. Not sure it would cause THAT much of an impact).
Per swapping the plotting - I guess I could disable swap, but that’d mean that I’m going to run out of RAM, no?
Using the same destination for both -2 and -d would be less than ideal, given that the -d is the slow HDD, and -2 is supposed to be fast SSD, right?
The -2 option just moves where the final plot file is assembled/built. Once built it has to be copied to the destination directory. If it is already in the destination directory then it is simply a rename (no copy needed), if not then it will be copied. So for a k32 file there is an extra 108 GB file copy if -2 is different from -d. In either case you are writing the 108 GB of data to your slow HDD once.
With regards to swapping I believe top can display swap activity on linux. In your case you want the activity to be zero (or infrequent).
Yup, currently 89% of my 32GB of RAM is being used, along with 2GB of swap. I’m thinking of disabling swap, but I may also need to reduce the number of processes I’m running in parallel to avoid ram overload.
I’ve got exactly the same issue after following the same guide. My phase 1 has more than doubled compared to using win gui (6ks to 13ks+), even compute is taking ages due to low cpu usage. Wasted 3 days now trying to get this running but really need to get some plotnlogs so I can get plotman up and running.
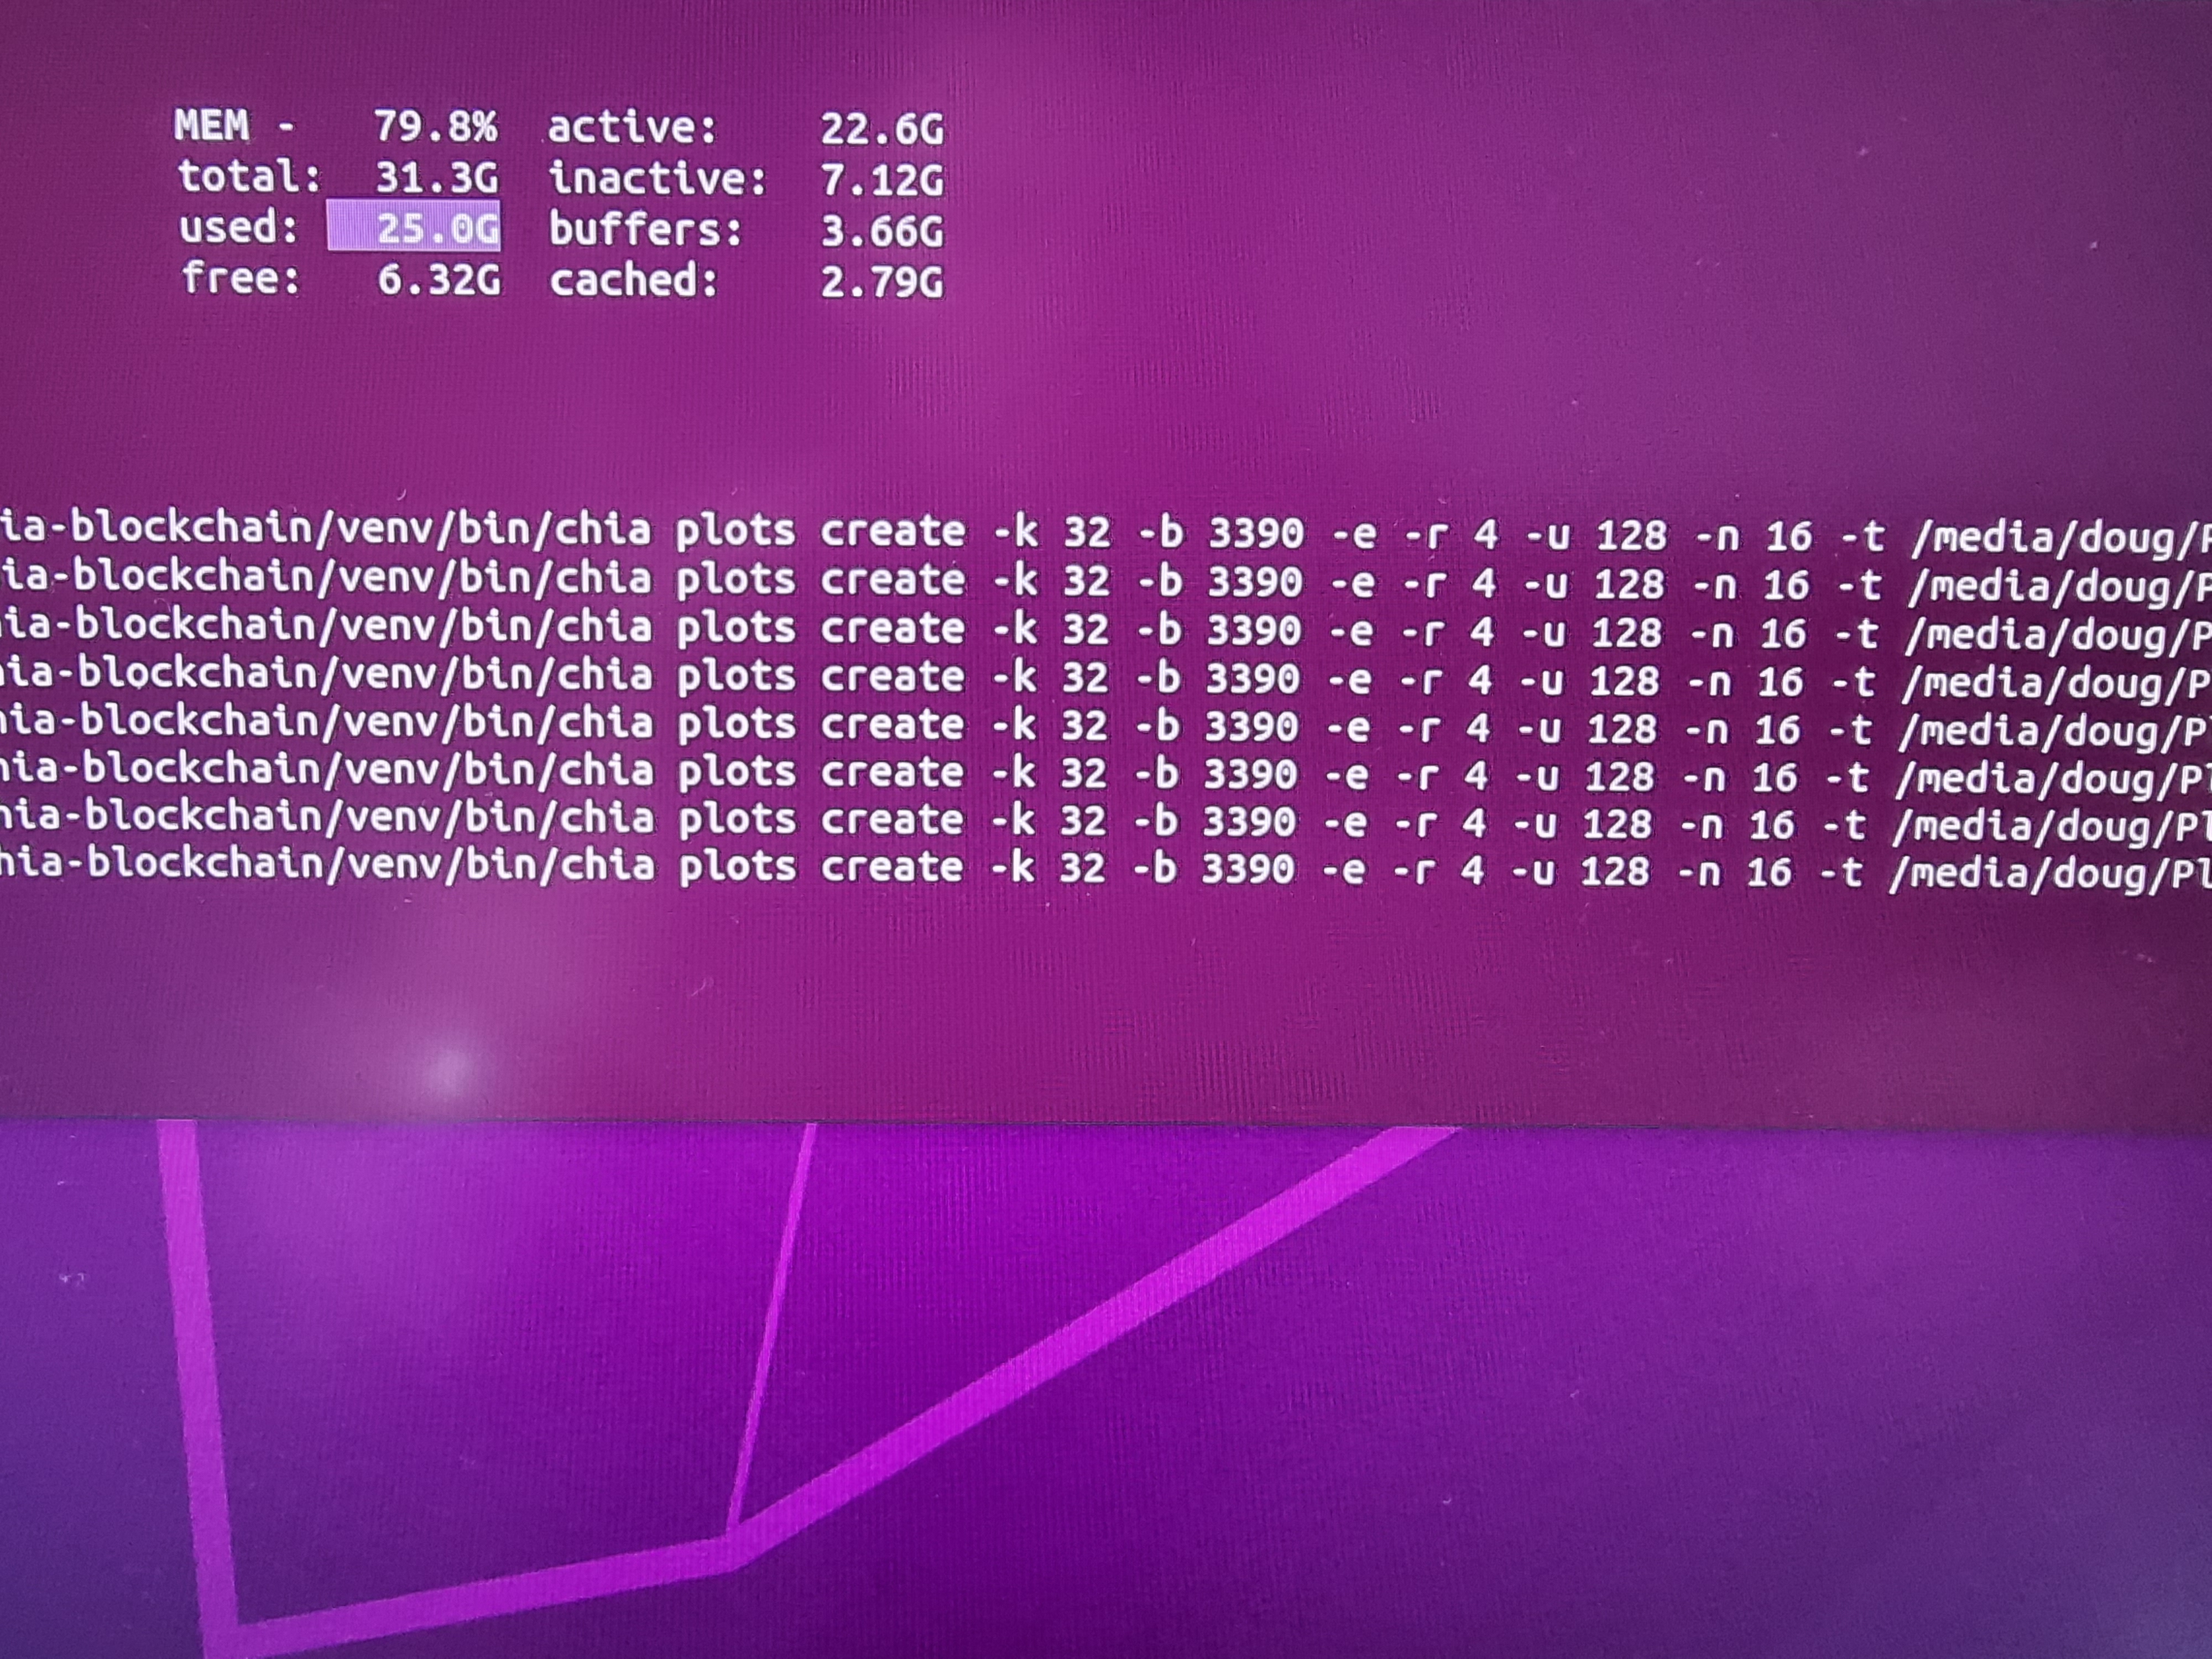
I used the batch in the guide with 32gb ram and it just swamped it along with swap and had to abort. Tried running again today but dialled the ram down to 3390 per plot and again painfully slow. RAM around 80%, 5950x hardly batting an eye lid, single 4tb mp510 onto 4 hdds (I put 2 plots onto each but 10hrs later it’s still not ready to move one over).
I’ll try tomorrow once these have finished with -e removed and chang -2 to the same as -d (my hdds). Glances is pretty much continuous mem swap with 8 plots going on so hopefully this will alleviate the problem. Crossing fingers -e removed will give the threads a kick up the bumnfor more grunt being used!
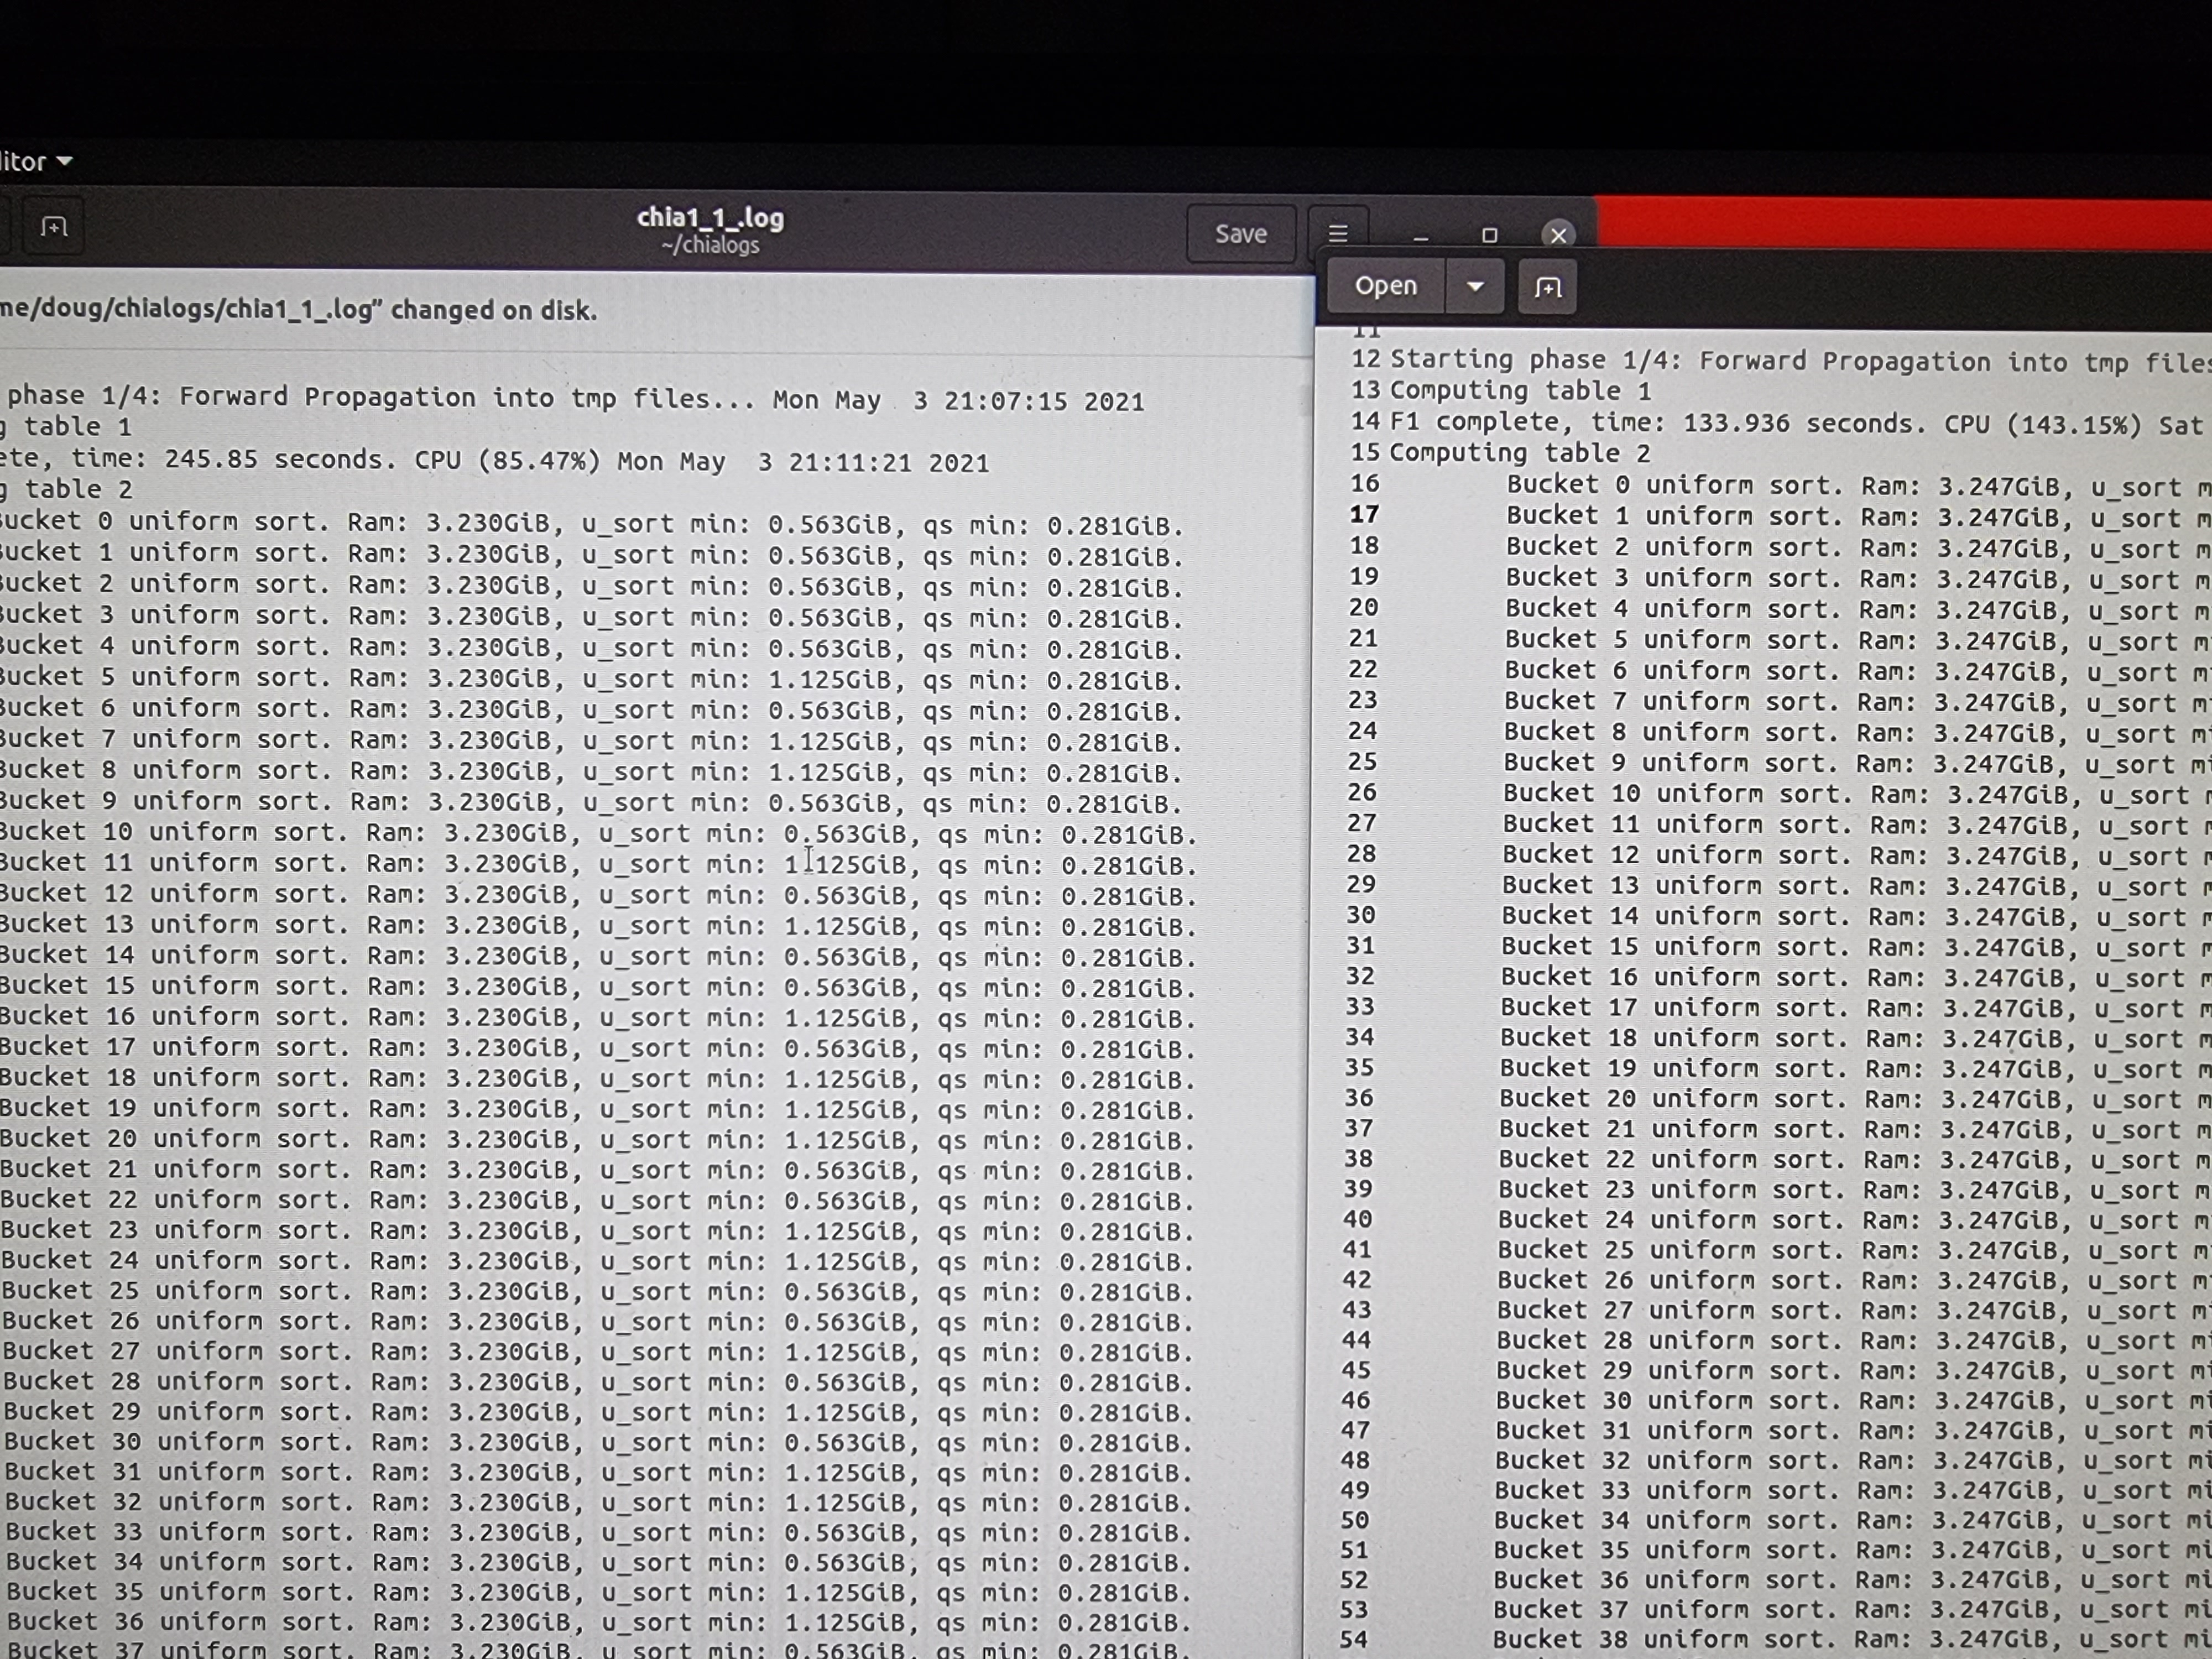
I’ve just restarted mine with -e removed, and -2 -d the same. Even on table 1 compute it’s seriously slow. Left is 8 threads assigned in Linux cli, right is only 3 threads assigned in win.
You likely both need to fix your -b setting for ram for -r2 You need 3390 if I recall correctly, this may actually vary depending architecture. When you monitor the plot you should be able to see a RAM amount of 3.251 when it starts the first few computations in phase 1. for -r4 you need more but I don’t recall the exact number I think it was 3408 or 3406 if you don’t want to go through the trouble of testing it you could set to 3420. If it uses a tiny amount more I wouldn’t sweat it but using 4000 which probably comes out to 3.8 or thereabouts is overkill especially when you don’t have the RAM to spare.
Eve - at the 4000 you set you’re overusing ~600 * 8 plots so 4.8 GB of ram. That will get you out of swap territory. Also if you are on a 10700k you only have 8 cores 16 threads. For 8 plots just do -r2 you could theoretically get more out of 4 threads, but not likely with your limited core count. More likely you’d have threads waiting in line for use because of oversubscription. I’d also recommend not doing a raid 0 with dissimilar drives. When you do that you are going to get the size limit of the smaller of the 2 drives, doubled. So if you have 1 TB and 2TB that would add up to a Raid 0 array of 2TB. Additionally the faster drive will slow down to the speed of it’s counterpart for operations. Giving you the worst of all worlds. Break it up and assign your plots to run on the drives proportionally. Likely one is a better performer than the other.
Dougie - You should be fine with -r 4 on the 5950x with the massive amount of cores but you don’t have enough ram for one of the computation cycles I think it’s Forward 4 maybe 5 in phase 1, where it uses 3.250. With -r 4 and 3390 you’ll be under that, which will push you to using quick sync cutting you’re speed in half for that step. Whole plot time is probably losing about 10%. Not sure of the benefit/penalty for using -e. I haven’t seen it in any of the recommended plotting scripts I’ve seen to date.
I plot under Windows. There was a note somewhere on here about SSD’s without trim enabled or something causing drastic slowdowns on Linux, but Linux plotting is out of my wheelhouse. Hopefully something in here helps.
Edited: increased 3.250 to 3.251. There appears to be some form of rounding involved so that even if the two numbers matched it could result in the plotter still dropping into quick sync mode.
Break the raid. Plot on your 2tb ssd and use your 1tb ssd as the final destination. Once it’s plotted it will copy to the ssd in a short time. Then make a script to move files from the 1tb to your storage drives. This will help with the time waiting for the final copy. You should be able to get 6-8 plots parallel. I’m getting 21000s on similar hardware.
Yeah, regardless of ram set, I’ve got 3400 in batch, my table 1 compute in Linux, even with 8 threads vs 2-3 is way out. CPU seems to be under utilised in Linux, no idea why…
In win gui, I’m 6-7ks phase 1, 16-17ks full plot. Not even doing 1 plot on Linux in the same time it takes me to do 8 plots in win. Miffed.
You are getting much higher CPU utilization from Windows according to that. You can think of CPU(XX.X%) as 100% is 1 core fully utilized. Windows you’re getting the equivalent of a core and a half. Linux less than 1 core. Haven’t followed Linux development enough to know at this point, but make sure your kernel has good support for Ryzen 5000. Hopefully this was a clean Linux install with that CPU and not a transplanted OS. Often that results in poor OS level optimization for the hardware. Not like a GPU where you can swap them out.
What I was referring to was what you see in your pictures “uniform sort. Ram: 3.xxxGiB”
That number should be 3.251 or greater, although I think greater than that is probably wasted as well.
Edited: increased 3.250 to 3.251. There appears to be some form of rounding involved so that even if the two numbers matched it could result in the plotter still dropping into quick sync mode.
Ah cool, even with the default setting in win gui it’s 3230 . I’ll go bump it up a touch.
Indeed, clean install. Did cross my mind if Linux needs the equivalent of chipset drivers etc? I get no core info when running sensors which I thought was odd…? I can pull up core speed but no temp info.
Edit: just looked up kernel, not something I’ve installed. Will go check it out.
Edit 2. Same deal with 5.12(?) Kernel, no change. Table 1 compute is around 80% cpu and more than double the time of win gui. Myself and OP must have something in common which is causing the painful plotting speed…
Thank you all for all your input! I made some slight changes to my hardware. Got a better motherboard, mounted my two nvme’s as 2 separate drives and using them separately as temp drives for plotting. I was running 8 parallel processes with the following command - chia plots create -k 32 -b 4000 -r 4 -u 128 -n 16 -t /mnt/ssd/temp1 -2 /mnt/ssd -d /mnt/hdd. (removed -e as suggested). I also disabled swap.
After plotting for a little while, grepping the logs for total time (using this command grep -i "total time" /home/jm/chialogs/*.log |awk '{sum=sum+$4} {avg=sum/NR} {tday=86400/avg*8*101.366/1024} END {printf "%d K32 plots, avg %0.1f seconds, %0.2f TiB/day \n", NR, avg, tday}') was giving me 2.29 TiB/day. However, after a day it dropped down to 1.9 TiB/day.
Also, I’m noticing that my RAM and CPU are not used at max capacity. CPU is around 70%, RAM around 80%. I ended up one more process - but it didn’t cause the spike in resources usage, and it also didn’t seem to have impacted my plotting speed drastically.
Also, looking at my cpu info, I see that all cores are ranging 2500 to 3500 MHz. May that be the bottleneck? If not - what else, do you think, may be tweaked/improved to increase the speed (and also make it use all CPU and RAM).
It’s not likely going to use all the ram all the time. I leave mine at default b and it never seems to reach? I hover in the 2-3GB ram use most of the time per plot. But I’m also only doing -r 2. And it’s only phase 1 that uses all the cores. The rest of the phases are single threaded I believe.
Not sure what else to tweak. Are you staggering your plots still? Maybe slightly longer stagger? Your numbers come out to roughly 19-21 ish plots per day, right? I’m getting around 8-10 running 4 parallel on a 3600/32GB for reference. Plus a 5th on an SSD giving me an extra ~3/day. I’m definitely i/o limited on my end. 5th on the NVMe was a bigger hit.
I run with a 2tb and a 1tb nvme un raided. I run 8 at a time 5 on the 2tb as my temp and 3 on the 1tb. I try to keep my nvme usage under 90% of storage capacity. 16 plots a day. Basically the same setup as you…there is also the secondary temp file you can take advantage of.