Extra Note: I tried to run CPU mining, then I can see it use 98%+ of the CPU.
During plotting, run Task Manager. On the left, you will see CPU, Memory, Disk 0 (C:), 1 (D:), 2 (E:), … Whichever disk will have the highest activity, click on that little chart. In the upper right corner, there will be the name of that drive (e.g., Samsung SSD 970 … in my case, most likely Seagate IronWolf, in your case).
Let us know what name you see there.
Actually, take a screenshot of that Task Manager, as it will show in the lower right what speeds your are getting.
None of my chia plotters reach 98% CPU usage , my only guesses is and that can happen
- Bad NVMe aka end of life time one…
- Setup on a system with a ton of other stuff on, not a clean system …
I’m not a big help here but try to move eg the NVMe to a different ‘clean’ system/PC and see
Honestly, at 98% CPU usage my systems would choke … for sure
CPU runs with the speed that other IO permits it to run. So, as you pointed out, either it is waiting on the drive, or on memory. Maybe a memory test would be good to run?
I don’t think that any extra setup on the system can compete with what a plotter requires, so would ignore that (especially on a threadripper CPU).
Another thing would be to check Event Viewer / Windows logs. Maybe there are errors listed there (i.e., some timeouts).
If the PM961 SSD 512GB isn’t overheating then it is possible that it is unable to sustain more than 200 MB/s over long periods of time. 512 GB SSDs are in general about 1.5-2.0 times slower in sustained writes than larger SSDs (1TB+). For example, WD Red SA500 (500 GB) can sustain 250 MB/s despite being a SATA III SSD (SATA III interface maxes out at about 560 MB/s).
The size of SSD’s SLC cache has zero benefits when plotting Chia (unless it is larger than 1.6 TB, which is unlikely).
For high-speed Chia plotting with less than 256 GB RAM, I would recommend 2 SSDs of the same capacity with very high sustained writes and set them up as RAID0. (RAID0 in BIOS, or the Btrfs filesystem can do RAID0 in software with disk partitions of the same size).
1 Like
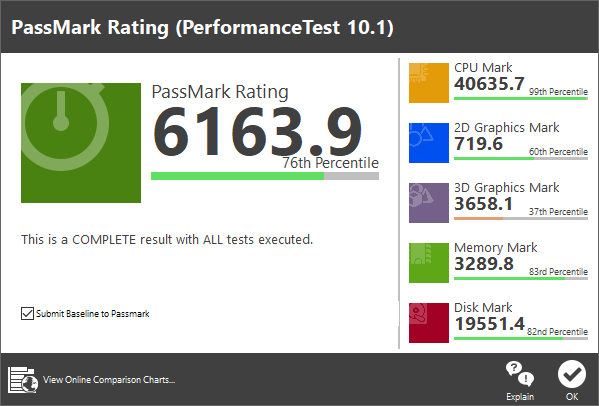
Actually, looking again at your memory screenshot, I have to say that I don’t understand it.
How much memory you have? In your first message, you indicated only 32GB. However, that image shows 64GB. That’s fine.
However, looks like you have 110 GB committed. That means that maybe you are heavily trashing, as the CPU is not really running from RAM, but rather from HD. Are you using some caching program that is trying to use your HD as caching memory?
Anyone that has a Windows plotter, could you run one plot, and check whether you also get that much committed memory? (On my i5-9600K, I have only 32 GB of RAM, and during the Phase 1, my committed memory is only 22 GB - less than available, so no trashing. And, my CPU is really struggling - 4 physical/logical cores. The single NVMe I have is just at about 20%, so it is clearly CPU bound process for me.)
Also, your memory shows with only 1333 MHz speed, and that is very low. Is that really 1333MHz memory, or you didn’t enable something like XMP in your BIOS? That CPU supports up to 2667 MHz speeds, so twice faster than what you have (what may indicate that XMP is disabled, thus half the speed).
Also, looking at your CPU image, you are running with only 2.47 GHz, where it should be somewhere around 3.4 GHz. So, your CPU thinks that this is a weekend (is heavily underutilized, not just that 19%, but also additional penalty for slowing the clock - power saving mode). If you don’t see your drives choking at 100%, that means that your CPU is stuck on some weird timeouts - most likely memory. Again, Event Viewer.
2 Likes
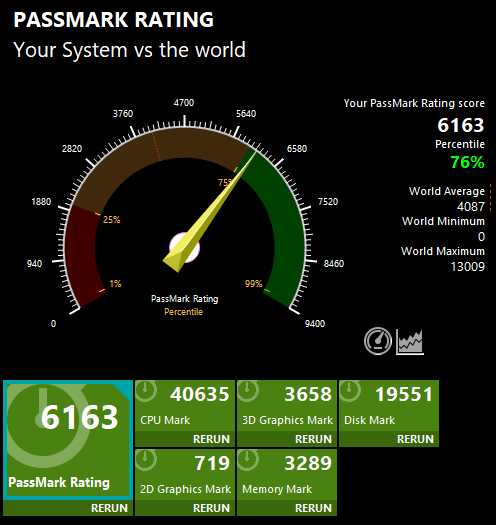
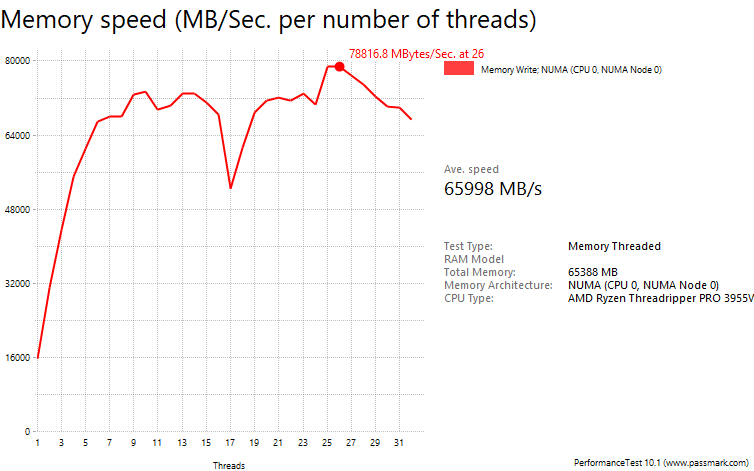
I got the trial sw and here are the results I got. I guess it only show that your TR is of an older vintage vs mine, which is almost ready to be updated to the 59XX series that should jump the performance yet again. Yeah AMD!
The biggest thing I note is your disk writing is not terribly good. Not sure if it is the model/brand or it’s age, or what. But that metric could certainly have a major effect on plotting performance.
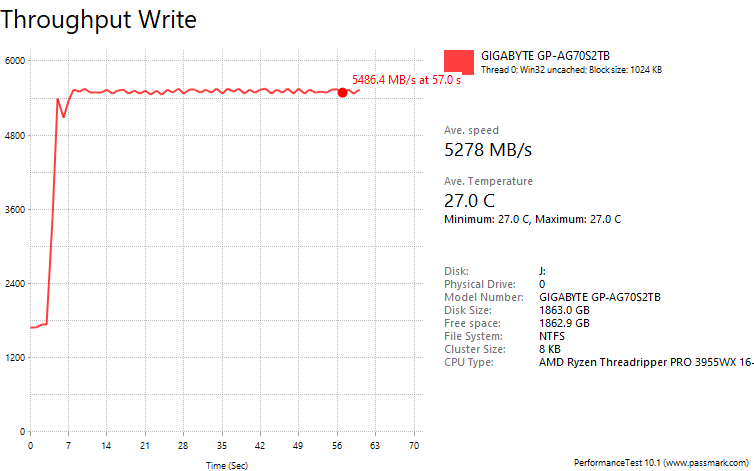
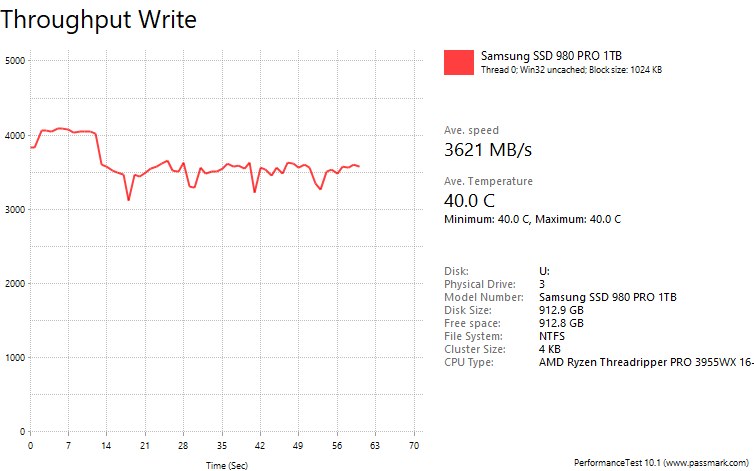
I use the Samsung 980 Pro for -t and the Gigabyte SSD for -2
Also included is my ‘Threaded Adv Memory Test’ speed graph for you to compare if you run yours.
I’d look into the SSD first. Hope some of it help you figure what is going on and you are able to rectify.
I’d venture your rig should be pretty decent if it was firing on all cylinders, so to speak.
3 Likes
If you check this page, his Samsung NVMe is running basically with 100% speed (average there is 996 MB/s, and his is 941 MB/s). Doesn’t that exclude potential problems with it? I mean, his plotting times are around 12 hours, not an hour or an hour and a half (what that speed would potentially cause).
To me, that NVMe looks like is not being used during plotting, as his D: drive smells like a HD. Still, assuming that it is HD, that should not be 12 hours. So, back to square one.
1 Like
I wasn’t trying to say there was a problem with it specifically, but as used for plotting, it’s not very fast. Beyond that it is ALSO used for both -t and -2. Further, it’s only 512GB and it’s the OS drive, meaning that activity, any virtual memory swap file use, etc compunds its struggle at only ~950 MB/s max write speed.
I’d venture the poor thing is just not up to the many tasks it is being called upon to do, resulting in poor performance overall in this situation. Perhaps one (or two ideally), nice fast 1tb nvme(s) to use for plotting alone - would do wonders.
PS. Is it possible as you mention that he’s using an HD for plotting??? That could be it. I was thinking otherwise! But D: as you say say, smells like the HD… and yes, 12 hr plots - I was thinking 2 hrs for some reason. That’s horrific.
2 Likes
Agree on all counts. Although, I would separate improvements from getting his problem resolved. Once the issue is identified, he can be guided how to fine tune his box. Otherwise, as you said, he is just confused with too much input.
Since you mentioned that this is his OS drive, that kind of implies that it is his C: drive, where when showing up his MM line, he is using his D: drive for both tmp and dst. So, that is the first bummer. Also, from that memory chart, for whatever reason, his memory is also slow (kind of 2010 level). That is not helping also. Still, I would think that it would push his plots to an hour or two max, not 12 hours.
If you also check again his writes chart, it shows that he has only about 90GB left there, what implies that there is no room for plotting on it (unless that test was run while plotting, of course).
I would really want to see his Event Viewer logs.
1 Like
In summary, it looks safe to conclude that hard drives for plotting works extremely poorly, even with a pretty fast system otherwise, and that appears to be the situation. And an easy fix it would seem.
2 Likes
Where can I find the event viewer logs?
You say HD, but the disk are SSD.
Your command-line only mentions the use of your D: drive ("-t D:\TEMP\ -d D:"), and your SSD is your C: drive based on the benchmarks you’ve shown. You should be using something like “-t C:\TEMP\ -d D:”
4 Likes
So my C disk is only for system.
My D:\ and E:\ is Seagate Ironwolf 10TB NAS SSD harddisk
When I read the guide about plotting and temp it said that it was possible to both have TEMP and write destination on same disk without delaying any progress.
Sure, that’s possible if you use nvme as temp and final.
But using a HDD as temp is much much slower than using a nvme.
2 Likes
That’s a hard disk drive (HDD), i.e. spinning platter(s) with read/write head(s) that move back and forth. It is NOT a solid state drive (SSD), i.e. flash memory and a controller, possibly some DRAM, zero moving parts.
Plotting on HDDs (i.e. using a folder on an HDD as your -t argument) is orders of magnitude slower than plotting on SSDs. Use your C: drive as your -t and your D: or E: drive as your -d as @Lamiaceae recommends above.
2 Likes
On that third image, the second item has a red exclamation point sign. Look for those. You can focus on Application and System logs, the other are rather irrelevant.
1 Like
Just for kicks, could you try to change your MM command to something like:
-t d:\tmp -2 e:\tmp -d d:\dst
And let us know how long your plot will take, and we will take it from there?
1 Like
This all goes back to plotting on a HDD (D: Seagate Ironwolf 10TB) instead of the SSD (C: Samsung PM961 512GB NVMe)
2 Likes