A field study at Google covering over 100,000 consumer-grade drives from December 2005 to August 2006 found correlations between certain SMART information and annualized failure rates:
In the 60 days following the first uncorrectable error on a drive (SMART attribute 0xC6 or 198) detected as a result of an offline scan, the drive was, on average, 39 times more likely to fail than a similar drive for which no such error occurred.
First errors in reallocations, offline reallocations (SMART attributes 0xC4 and 0x05 or 196 and 5) and probational counts (SMART attribute 0xC5 or 197) were also strongly correlated to higher probabilities of failure.
Conversely, little correlation was found for increased temperature and no correlation for usage level. However, the research showed that a large proportion (56%) of the failed drives failed without recording any count in the “four strong SMART warnings” identified as scan errors, reallocation count, offline reallocation and probational count.
Further, 36% of failed drives did so without recording any SMART error at all, except the temperature, meaning that SMART data alone was of limited usefulness in anticipating failures.
Right off the bat… “SMART data alone is of limited usefulness in anticipating failures”
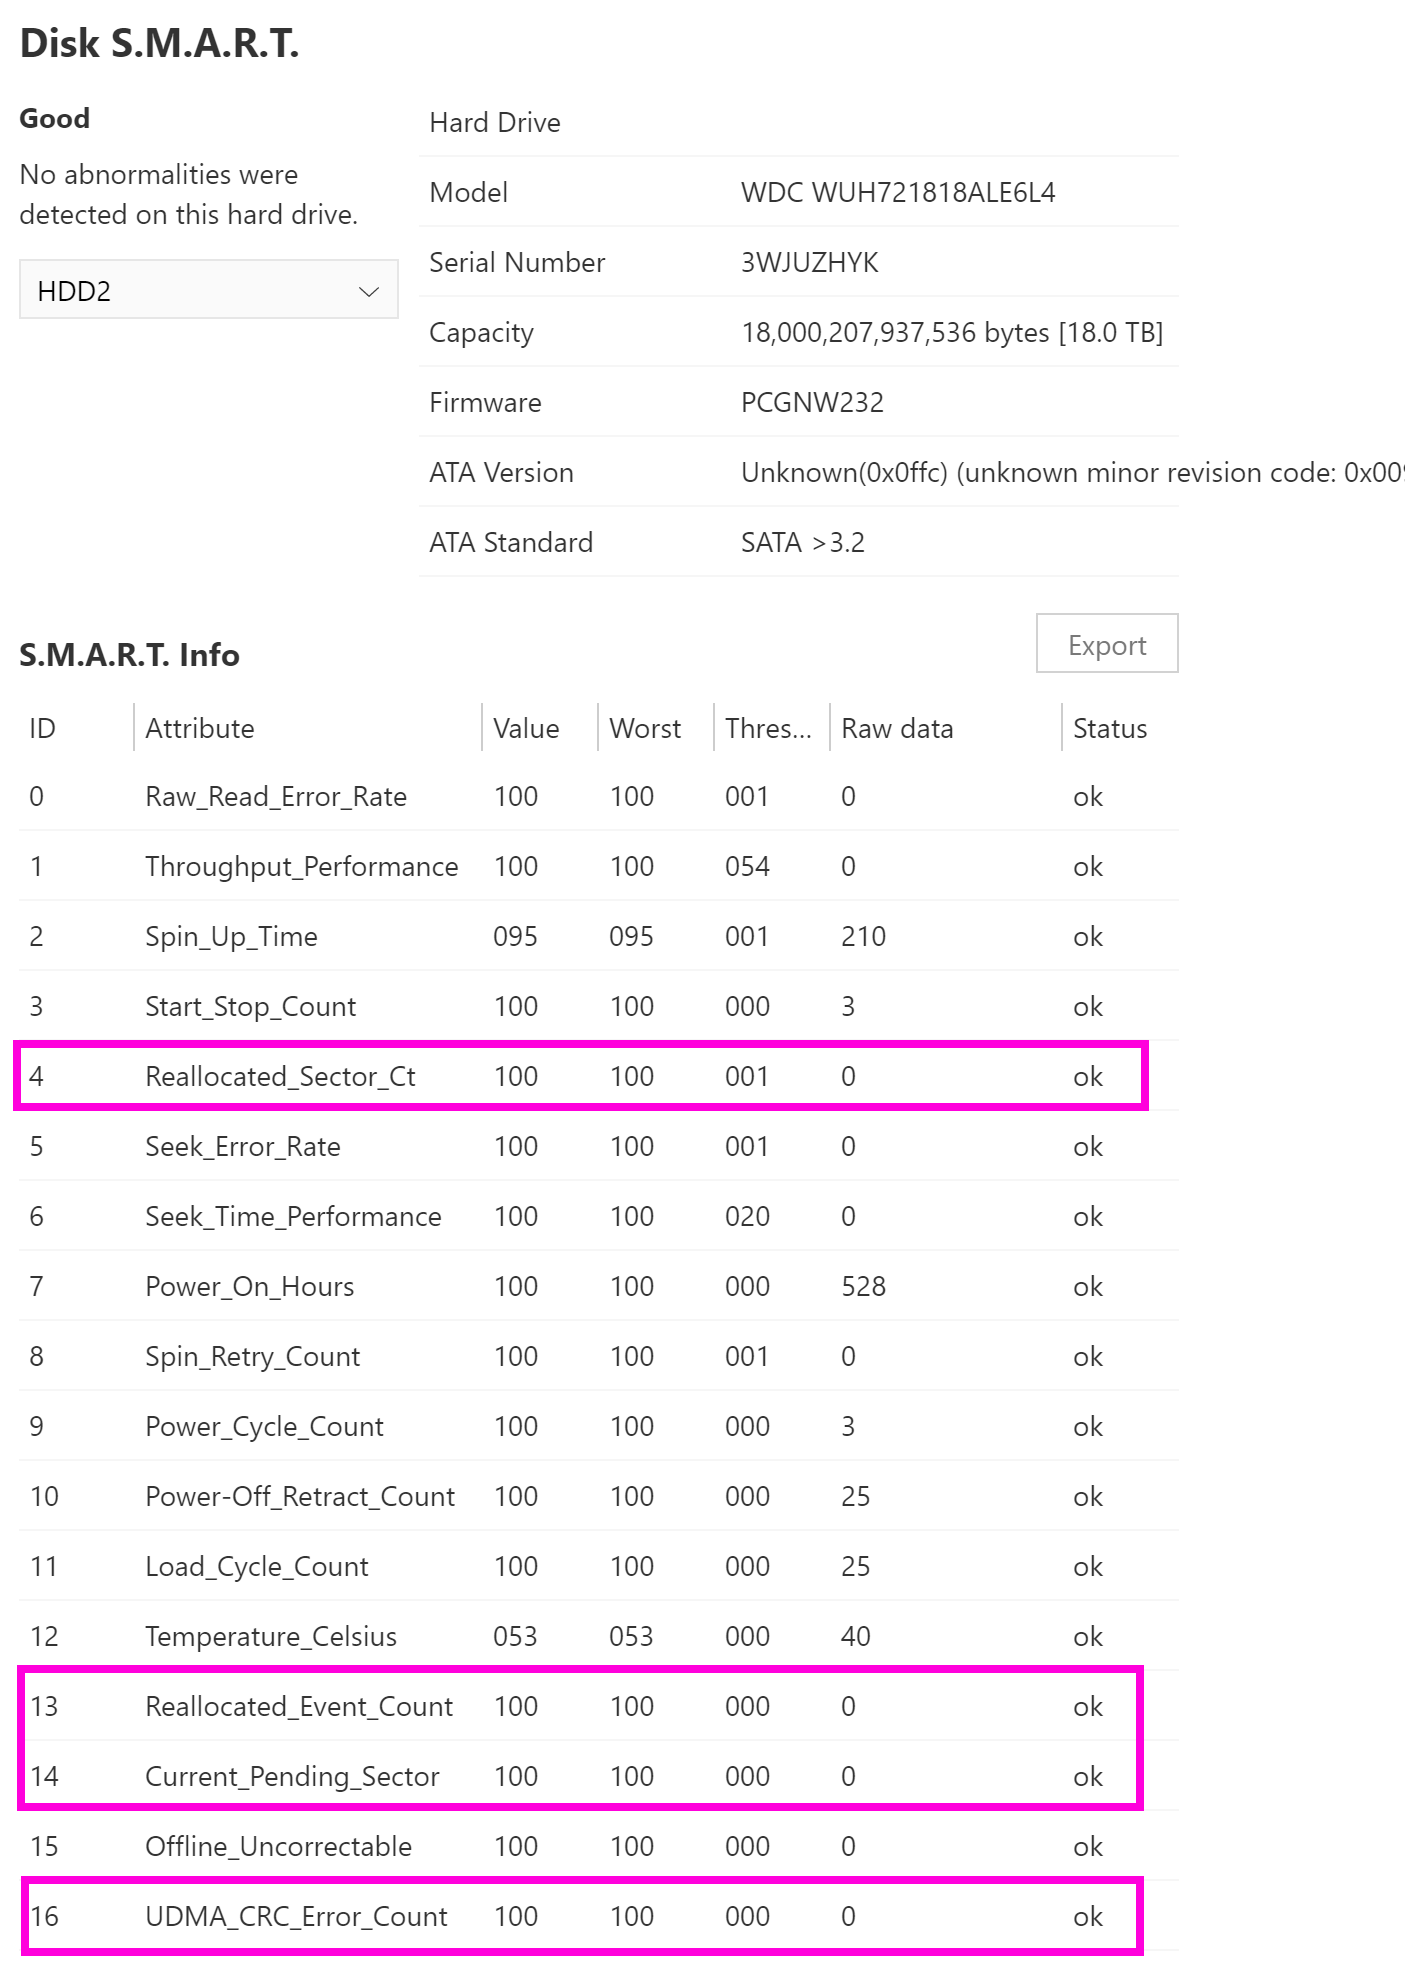
The most important in my experience are Reallocated_Sector_Ct, Reallocated_Event_Count, and Current_Pending_Sector. They should all be 0 ideally. That’s the main 3 I always look at. Any Current_Pending_Sectors that won’t go away would warrant extra investigation.
I think UDMA_CRC_Error_Count is sometimes an indicator there’s a bad cable.
----------------------------------------------------------------------------
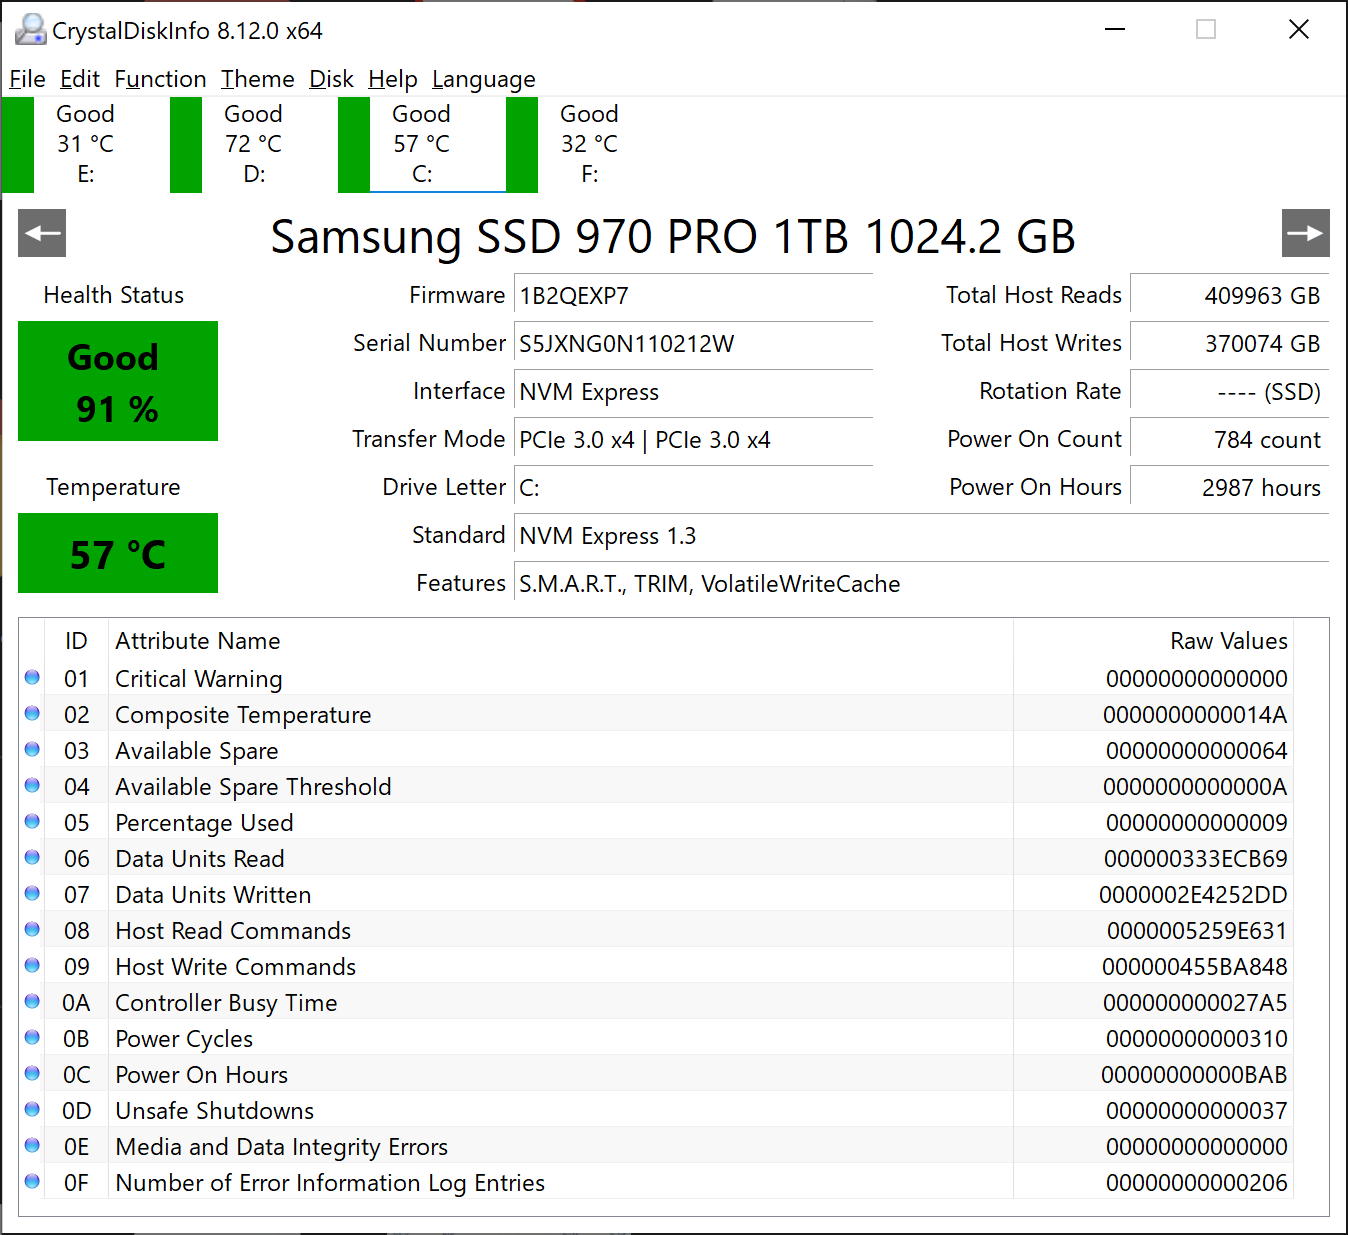
(03) Samsung SSD 970 PRO 1TB
----------------------------------------------------------------------------
Model : Samsung SSD 970 PRO 1TB
Firmware : 1B2QEXP7
Serial Number : S5JXNG0N110212W
Disk Size : 1024.2 GB
Buffer Size : Unknown
# of Sectors :
Rotation Rate : ---- (SSD)
Interface : NVM Express
Major Version : NVM Express 1.3
Minor Version :
Transfer Mode : PCIe 3.0 x4 | PCIe 3.0 x4
Power On Hours : 2987 hours
Power On Count : 784 count
Host Reads : 409963 GB
Host Writes : 370074 GB
Temperature : 57 C (134 F)
Health Status : Good (91 %)
Features : S.M.A.R.T., TRIM, VolatileWriteCache
APM Level : ----
AAM Level : ----
Drive Letter : C:
-- S.M.A.R.T. --------------------------------------------------------------
ID RawValues(6) Attribute Name
01 000000000000 Critical Warning
02 00000000014A Composite Temperature
03 000000000064 Available Spare
04 00000000000A Available Spare Threshold
05 000000000009 Percentage Used
06 0000333ECB69 Data Units Read
07 00002E4252DD Data Units Written
08 00005259E631 Host Read Commands
09 0000455BA848 Host Write Commands
0A 0000000027A5 Controller Busy Time
0B 000000000310 Power Cycles
0C 000000000BAB Power On Hours
0D 000000000037 Unsafe Shutdowns
0E 000000000000 Media and Data Integrity Errors
0F 000000000206 Number of Error Information Log Entries
----------------------------------------------------------------------------
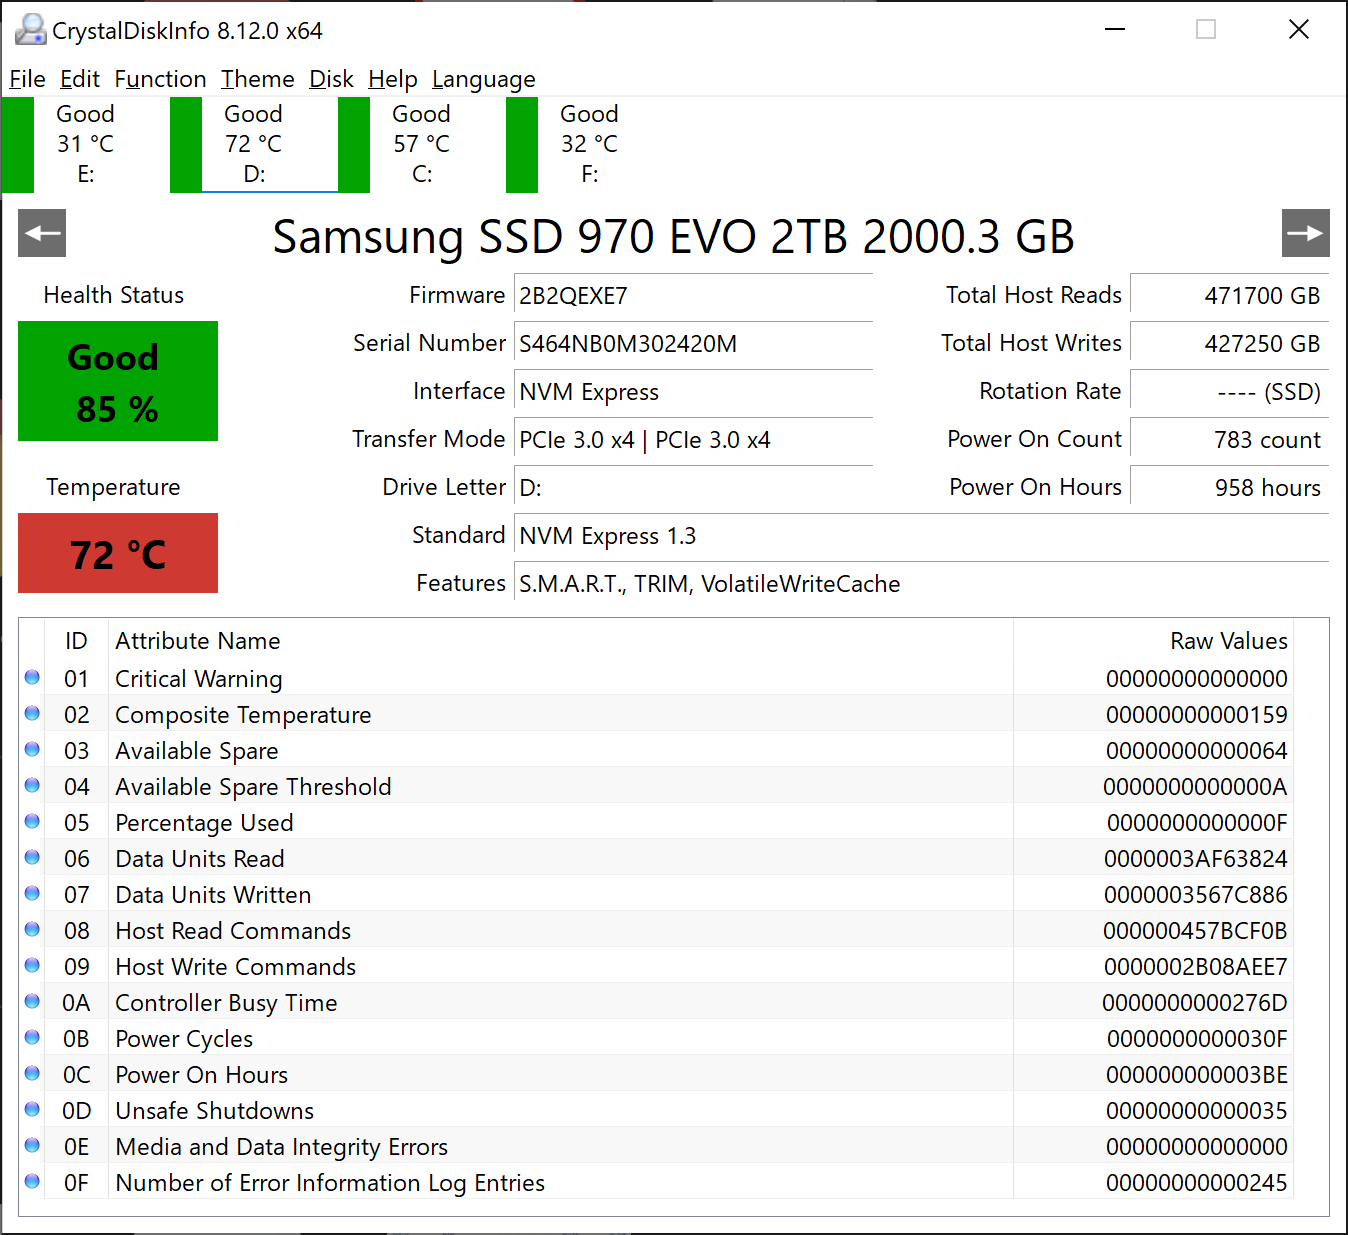
(02) Samsung SSD 970 EVO 2TB
----------------------------------------------------------------------------
Model : Samsung SSD 970 EVO 2TB
Firmware : 2B2QEXE7
Serial Number : S464NB0M302420M
Disk Size : 2000.3 GB
Buffer Size : Unknown
# of Sectors :
Rotation Rate : ---- (SSD)
Interface : NVM Express
Major Version : NVM Express 1.3
Minor Version :
Transfer Mode : PCIe 3.0 x4 | PCIe 3.0 x4
Power On Hours : 958 hours
Power On Count : 783 count
Host Reads : 471700 GB
Host Writes : 427250 GB
Temperature : 72 C (161 F)
Health Status : Good (85 %)
Features : S.M.A.R.T., TRIM, VolatileWriteCache
APM Level : ----
AAM Level : ----
Drive Letter : D:
-- S.M.A.R.T. --------------------------------------------------------------
ID RawValues(6) Attribute Name
01 000000000000 Critical Warning
02 000000000159 Composite Temperature
03 000000000064 Available Spare
04 00000000000A Available Spare Threshold
05 00000000000F Percentage Used
06 00003AF63824 Data Units Read
07 00003567C886 Data Units Written
08 0000457BCF0B Host Read Commands
09 00002B08AEE7 Host Write Commands
0A 00000000276D Controller Busy Time
0B 00000000030F Power Cycles
0C 0000000003BE Power On Hours
0D 000000000035 Unsafe Shutdowns
0E 000000000000 Media and Data Integrity Errors
0F 000000000245 Number of Error Information Log Entries
Note that in addition to SMART you’re seeing total writes; I have been burning through a lot of plots on these two drives so I’ll have to replace them eventually
You can use something like Scrutiny to have a Web interface for smartctl. It runs on docker, so the setup is almost one-line (if you have it installed)
NVME support is not working great (at least for my nvme drives) but the SATA Drives are showing just fine, and you’ll have Temps and status checks of all your drives in a single page
OK! I’ve stopped chia plotting on this machine for good, let’s check the final SMART stats.
Started April 24th, 1:24 pm with these stats:
Samsung 970 Pro 1tb (1 plot)
Good 91% – Reads 409,963 GB – Writes 370,074 GB
Samsung 970 Evo 2tb (2 plots)
Good 85% – Reads 471,700 GB – Writes 427,250 GB
Finished May 29th, 1:59pm with these stats:
Samsung 970 Pro 1tb (1 plot)
Good 85% – Reads 662,635 GB – Writes 603,687 GB
Samsung 970 Evo 2tb (2 plots)
Good 67% – Reads 924,283 GB – Writes 885,834 GB
That’s a continuous plotting time of at least 35 days – two parallel plots on the 970 Evo, and one parallel on the 970 Pro… so over those 35 days the drives accumulated these many reads and writes:
What do you do when smartctl reports that SMART is unavailable? I have all identical 12TB WD My Book drives, and only a few of them report smart data. 90% of them are unavailable for some reason, even though they’re all formatted the same way and attached to the same USB hub.
I also tried hddtemp, which says SMART is unsupported for all drives, even the ones where smartctl works.