2nd Temporary Directory Experiments

There are a couple topics on here about the 2nd Temp Directory. What it does, benefits and such. But basically all of them ask the questions but I haven’t found any real data about the benefits. We kind of know the basics of what using it is supposed to do, but I haven’t found any information about how well using it works. So, I’m going to do a couple experiments. Here is the plan. I currently have one system plotting, the current configuration is shown below. It is plotting 8 plots in parallel using Swar’s plot manager. I will be collecting data from it’s performance over the next week. Tomorrow, I will be bringing a system online that is identical to the first, but there will be one difference. It will have a Samsung 870 QVO 2TB (SATA SSD) in it. I will setup that SATA drive as the 2nd Temp Directory. If it appears to be running at least as fast as the original system and the SATA is not causing it to slow down, I will run it that way for the week also and collect performance data. Then next weekend (or Wednesday if the SATA is causing a slowdown), I will either be replacing the SATA drive with an NVME (if the SATA is causing an issue) or if the SATA drive is doing well, I will add the NVME to the original system and run them side by side to see how much an NVME improves the 2nd temp drive over a SATA.

The current system has the following

  • Motherboard: GIGABYTE Z490 UD
  • Processor: Intel Core i7-10700K
  • Heatsink: Enermax ETS-T50
  • RAM: Teamgroup Elite Plus DDR4 32GB (2 x 16GB) 3200MHz
  • OS HD: 250 GB SSD
  • Temp Drive: Samsung 970 EVO Plus SSD 2TB
  • NVME extension cable: Sintech M.2 NVME Extender
  • Power Supply: EVGA 500 GD
  • Case: NZXT H510

So, let the games begin.

8 Likes

The best I’ve found is this

But more experiments are very welcome! :beers:

1 Like

Oh and I am running on Windows 10 Pro and version 1.1.5 of Chia.

I wonder how much space does each phases take… for example if someone is running a 1tb drive and can only fit 3 parallel plots… Would adding a second temp directory make it possible to fit 4 plots in the first temp directory on the 1tb drive?

1 Like

These are the types of questions I also have and plan to address during these experiments. If anyone else has other questions, post them up and I’ll do my best to get clear data to answer them.

1 Like

Looking forward to the results. Thanks for doing this!

@WolfGT I just came across FAQ · Chia-Network/chia-blockchain Wiki · GitHub and thought it might help

That’s been my experience. Without -2, the *.2.tmp files get written along with the other temp files. Those files grow to the size of the final plot. So if you can comfortably plot 3 in parallel on a 1TB drive, but not four, using -2 to build that file on another drive can help you support 4 in parallel on the primary temp drive.

It does get somewhat weird sometimes, though. For instance, it’s tempting in some configurations to point -2 at spinning rust. That … doesn’t work well as it’s really easy to end up bottlenecking hard if you have a few plots in phase 3.

Where it works well is if you have say 1TB of NVME, say another 1TB of SATA SSD, and are sending completed plots to slow storage. As long as you can copy things from the SATA drive to their final destination fast enough to not get backed up, that kind of setup can work well.

2 Likes

That’s what I was thinking, I have an asus hyper on the way and was thinking I could use the 4 nvme and use the ssds for temp2 before they are moved to external drives.

1 Like

Trying this now as we speak, will update once I get a few plots completed with four in parallel.

I suspect that will work well. I have a dedicated server with 4 1TB NVMEs. Due to … reasons … 3 of them are ganged together in a RAID0 for temp, with -2 and final destination on the 4th (along with the OS). It’s currently running 12 in parallel, and plopping out about two plots per hour.

3 Likes

Here is the first experiment. I setup the new system last night (specs in first post) and ran a single plot with a 2nd temp drive configured. I then spent the next 5 hours watching it. I watched the folders and I/O on each folder. Here is what I found. (a lot of information, maybe too much, but I just wanted to document for my own sanity. Posted here for anyone that may be interested.)

From this point forward, I will refer to the 1st temporary folder as temp1 and the 2nd as temp2.

PHASE 1
When the job first starts, files start to appear in Temp1. At the same time, one file appears in Temp2. The file in Temp2 looks exactly like the final plot file in its temp state (extension .plot.2.tmp). It has 0KB size. Besides the creation of this file, there is no activity on temp2 during phase 1. During phase 1, the number of files in Temp1 climbed well over 200, I didn’t see the highest number. But then it started to decrease. It appears that the large number of files that are created are working files and then there are the plot table files. There are 7 files with the extension of .plot.table#.tmp and one file with plot.sort.tmp. The working files which have the extension .plot.p1.t#.sort_bucket_#.tmp seem to come and go as needed (there are 127 of these files per table) and the sort/table files grow during phase 1. The .plot.table1.tmp is the first to grow. Then table2 and so on all the way to table7. The largest I saw the folder get during this phase was 162GB. Here are the final table sizes.

table1 = 14.506 GB
table2 = 21.759 GB
table3 = 21.760 GB
table4 = 21.760 GB
table5 = 21.761 GB
table6 = 21.763 GB
table7 = 41.954 GB

PHASE 2
All the phase 1 working files disappeared and then files with the extension .plot.p2.t#.sort_bucket.tmp appeared (the first set were for table7). The file on temp2 still has a size of 0KB at this point. Then a short time later all the working files disappeared again. And then working sort files for table 5 & 6 showed up. It worked its way down through the tables. After the working files populated for each table, the original table file would drop to 0KB. It did this all the way down the list of tables. But tables 7 and 1 did not reduce in size. Disk activity on Temp1 (viewed with Task Manager) dramatically dropped when it entered phase 2. In phase 1 it was jumping around 20-30%, in phase 2 it is down around 2-6%. The largest I saw temp1 go was 236 GB. It made tables 2-6 0KB. Tables 7 and 1 stayed populated.

PHASE 3
New working files showed up on temp1. A second set of working files for table two. This time with .plot.p3.t2.sort_bucket_#.tmp as the extension. And for the first time, the file on Temp2 gained some size. 1KB. It begins to write from the .plot.p2 files into the .plot.p3 files. The .plot.p2 files disappear as they are written over. The sort file still has 0 size. As it finished with table 2, table1 finally went to 0KB. The size of the Temp2 file is climbing now. During this time, some new .plot.p3s.t2… files showed up (maybe s for sorting). As these files get processed the file on Temp2 grows. Currently Temp1 is at 211GB. The only table file left with any size is table7 and it is still at 41.9GB. The .plot.sort.tmp file still has no size. During this time, the read traffic on temp1 has spiked and the write traffic on temp2 is spiking in waves to about 30%. But not often. While all this is going on, table7 is still the same size as it was at the end of phase 1. As it finishes processing the .t#s files for each table, the size of the tmp file on temp2 grows. As it is processing .p3s.t6 files, the working files for table 7 showed up (both .p3 and .p3s). Basically it spends phase 3 sorting tables on temp1 and writing the output to the tmp file on temp2.

PHASE 4
There is still 71GB of data in temp1. The table 7 file is still there (41.9GB) and all the working files for table 7 (the .p3s.t7 files). The file on temp2 is now at 105.272 GB and temp2 now has decent I/O at this point. I/O on temp1 has dropped to almost nothing. As phase 4 progressed, the files in temp1 slowly started to disappear. As they did, the file in temp2 grew to 106.3GB.

PHASE 5
Then phase 5 started (the transfer to final drive).

So basically, during phase 4 and 5, temp1 I/O is eliminated and is offloaded to the temp2 and I’m sure there is some load removed in phase 3 because it is not writing that final tmp file to temp1.

Interesting observation, the file with the extension .plot.sort.tmp never did anything. I never saw that file have any size at all.

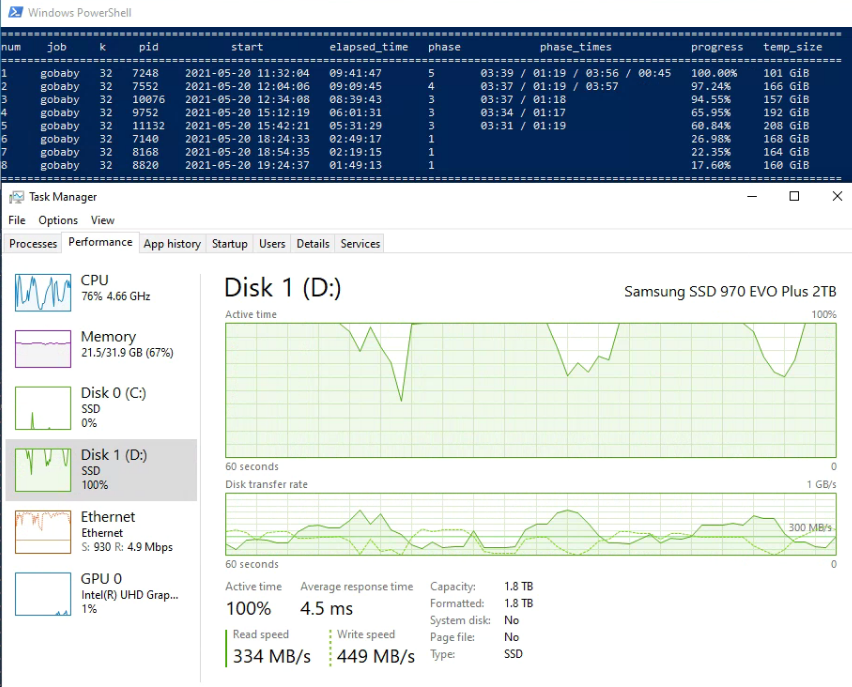
I never saw temp2 I/O anywhere near maxed out. The highest I saw was 30% and that was in short spikes. During the final transfer, it ran steady read at 21% (120MB/s Read) with the ethernet maxed out (1Gbps).

Now I am starting Swar’s with exactly the same setup as my first plotter but with the 2nd Temp Folder added. I will let it run for a couple days and get settled in. I will then report back to see if there is any performance improvement.

8 Likes

I’m curious to know if using nvme for temp1 and ssd for temp2 has any improvements.

Good start, looking forward to more experimentation.

At this point, I’m not going to do the NVME as a second temp folder. I am getting really good performance out of the SATA SSD and it isn’t being pushed very hard. I don’t see gaining that much by going NVME at the level I’m at. That and the NVME I have is a 2TB which would be a waste of money to use in that capacity. I’m going to send that drive back. But I am still running the test with the SATA. It was running so well, I needed to change some settings to get more out of it. I’ll know in a couple days what the improvement is but so far it looks pretty good.

I basically went thru what you did with -2 drive. I took a very good PCI-E 4.0 drive to use for the experiment. I also found minimal load of the 2nd temp, then the copy to final from there. There was minimal effect of times and it appears to be a waste to do this. Any ssd worth anything in plotting can handle the load wo/temp2, or it should. I repurposed the -2 drive to create x3 more plots, far more useful. I think the usefulness of -2 went away as they upgraded versions.

I will have numbers tomorrow. But it is obvious that just adding a $100 SATA SSD to the system and setting it up as the 2nd temporary folder has increased the output of that system considerably.

5 Likes

Ok then, here we go. A quick refresher of what this is. I took two systems that were exactly the same. Then on one of them, I added a 2TB SATA SSD and set it as the second temporary directory. I am running Swar’s plot manager.

A heads up, these results may not work for others. My NVME drives are not the best. If I had really fast NVME drives, being backed up by a SATA SSD as the second temp may not work. It may get overwhelmed.

But as for this setup. Yesterday the one without the drive created 19 plots. The one with the drive created 23. I think I could get another 1 or 2 out of it with some more tweaking of the Swar’s settings. But I will be rebuilding these systems on Friday so I’m just not going to mess with it right now.

This image is of the system with the extra drive. I include the current plot list (the black part at the top) and Task manager showing the activity. The system is pretty happy. Not being pushed very hard.

And this is the other system without the second temp dir. You can see that the main SSD is working much harder. I know that the phases are not an exact match, but whenever you look, it is like this. The system above rarely maxes out the NVME. This one will run 100% I/O for a long time when a phase 1 kicks off.

As for the size of the second drive. If you are running a 2TB main drive, the second drive can be half that (to be safe). But you could get away with a 500GB drive. So a pretty big improvement for such a cheap addition.

5 Likes

Interesting. I don’t know much about measuring IO wait time on Windows but I’m curious what that metric looks like for you over the life of a single plot during concurrent runs. I have 2 vastly different setups from you but being kind of obsessed with smoothing out IO wait because less should be more over time while concurrently plotting, I’ve eliminated 2nd tmp drives on both setups. I’m left with…

plotter1 (current run + daily stats):
     plot id    k          tmp                 dst   wall   phase    tmp      pid   stat     mem    user    sys     io
    875c0f00   32   /mnt/plot0   /mnt/plottransfer   0:25     1:3    96G   380104    SLP   19.9G    1:00   0:02     0s
    b27232b3   32   /mnt/plot0   /mnt/plottransfer   0:37     1:3   120G   376292    SLP   19.9G    1:25   0:03     0s
    dfdd8583   32   /mnt/plot0   /mnt/plottransfer   0:42     1:3   134G   374398    SLP   19.9G    1:38   0:04     0s
    08e0a4e8   32   /mnt/plot0   /mnt/plottransfer   1:16     1:4   164G   363866    SLP   19.9G    2:44   0:07     0s
    8996f308   32   /mnt/plot0   /mnt/plottransfer   3:03     2:1   170G   334389    RUN    2.1G    6:25   0:17     0s
    6dab13a6   32   /mnt/plot0   /mnt/plottransfer   3:13     2:1   197G   330947    RUN    2.1G    6:34   0:17     0s
    7d392c8f   32   /mnt/plot0   /mnt/plottransfer   4:10     2:4   229G   313141    RUN    2.1G    7:28   0:19     0s
    fb76e41a   32   /mnt/plot0   /mnt/plottransfer   4:17     2:5   243G   310658    RUN    2.1G    7:32   0:19     0s
    e0e21feb   32   /mnt/plot0   /mnt/plottransfer   4:41     3:1   226G   302919    RUN   19.8G    7:52   0:20     0s
    a9ca9c3b   32   /mnt/plot0   /mnt/plottransfer   5:19     3:2   206G   290937    RUN   19.8G    8:33   0:23    22s
    e4e8f833   32   /mnt/plot0   /mnt/plottransfer   5:58     3:4   178G   278541    RUN   19.7G    9:07   0:26   0:02
    7b671dc1   32   /mnt/plot0   /mnt/plottransfer   6:58     3:5   145G   259621    RUN   19.8G   10:06   0:30    23s
    a8f4d99f   32   /mnt/plot0   /mnt/plottransfer   7:34     4:0   152G   248259    RUN   19.6G   10:31   0:33   0:01
+-------+----+-------------+---------------+--------------+---------------+--------------+--------------+
| Slice | n  |   %usort    |    phase 1    |   phase 2    |    phase 3    |   phase 4    |  total time  |
+=======+====+=============+===============+==============+===============+==============+==============+
| x     | 36 | μ=100.0 σ=0 | μ=10.9K σ=881 | μ=5.5K σ=572 | μ=10.7K σ=492 | μ=734.5 σ=62 | μ=27.8K σ=2K |
+-------+----+-------------+---------------+--------------+---------------+--------------+--------------+
plotter2:
     plot id    k          tmp                 dst   wall   phase    tmp      pid   stat     mem   user    sys     io
    b11dc257   32   /mnt/plot3   /mnt/plottransfer   0:09     1:2    54G   440133    SLP   19.9G   0:14   0:01     0s
    8e7fbacb   32   /mnt/plot3   /mnt/plottransfer   0:25     1:3   106G   436152    SLP   19.9G   0:47   0:03     0s
    fbd276d5   32   /mnt/plot3   /mnt/plottransfer   0:57     1:4   163G   428822    SLP   19.9G   1:45   0:06     0s
    48af6f29   32   /mnt/plot3   /mnt/plottransfer   1:10     1:5   172G   425794    SLP   19.9G   2:07   0:07     0s
    d772d60c   32   /mnt/plot3   /mnt/plottransfer   1:20     1:5   172G   423167    SLP   20.1G   2:23   0:09     0s
    7129c7d1   32   /mnt/plot3   /mnt/plottransfer   2:36     2:1   189G   410019    RUN    2.1G   4:32   0:16    50s
    443c3c8e   32   /mnt/plot3   /mnt/plottransfer   2:53     2:2   200G   405966    RUN    2.1G   4:50   0:17   0:01
    afb44b02   32   /mnt/plot3   /mnt/plottransfer   3:01     2:2   201G   403869    RUN    2.1G   4:59   0:17    56s
    95311350   32   /mnt/plot2   /mnt/plottransfer   3:09     2:4   212G   401767    RUN    2.1G   4:59   0:22     0s
    15af1567   32   /mnt/plot3   /mnt/plottransfer   3:30     2:4   241G   396989    RUN    2.1G   5:19   0:18   0:01
    7919d072   32   /mnt/plot1   /mnt/plottransfer   3:39     2:5   226G   394963    RUN    2.1G   5:24   0:26     0s
    f9f859f1   32   /mnt/plot3   /mnt/plottransfer   3:49     3:1   238G   392362    RUN   20.3G   5:37   0:19   0:01
    b3ff3d82   32   /mnt/plot3   /mnt/plottransfer   4:20     3:2   212G   385348    RUN   19.7G   6:08   0:22   0:02
    906cf8be   32   /mnt/plot1   /mnt/plottransfer   5:00     3:3   186G   376234    RUN   19.8G   6:40   0:35     0s
    5ccdf3e6   32   /mnt/plot2   /mnt/plottransfer   5:24     3:5   164G   370477    RUN   19.7G   6:57   0:34     0s
    b5278c7d   32   /mnt/plot3   /mnt/plottransfer   5:43     3:5   156G   366081    RUN   19.7G   7:17   0:27   0:04
    68f344c9   32   /mnt/plot3   /mnt/plottransfer   6:08     3:5   145G   360185    RUN   19.8G   7:43   0:30   0:04
+-------+----+-------------+--------------+--------------+---------------+--------------+---------------+
| Slice | n  |   %usort    |   phase 1    |   phase 2    |    phase 3    |   phase 4    |  total time   |
+=======+====+=============+==============+==============+===============+==============+===============+
| x     | 35 | μ=100.0 σ=0 | μ=8.5K σ=331 | μ=4.9K σ=248 | μ=10.2K σ=240 | μ=674.4 σ=66 | μ=24.3K σ=545 |
+-------+----+-------------+--------------+--------------+---------------+--------------+---------------+
1 Like

Ah, yes. I knew there was something else I wanted to include. Thank you for reminding me. I don’t have the average thing you have there (I think that is a plotman thing. If it isn’t, let me know and I’ll run it). But here are screenshots of each systems plots for yesterday and today.

In the same order as before. This is the system with the extra drive. Total of 45 plots. (plus the 8 currently running). As you can see on this one, it can still be improved, every 8th plot had a delay. So if I wanted to tweak it, I think I could get another 1 or 2 per day.

And the one without the drive. Total of 38 plots. (plus the 8 that are running)

3 Likes

…I do appreciate the Swar reporting! Nice to have discrete copy time there.