SuperMicro X9DRi-F
1 x Xeon E5-2697 v2 (12C,24T; 2,70Ghz)
2x Seagate Firecuda 520 512GB
256GB (8x32GB) Samsung PC3-L-12800L 4Rx4 ECC
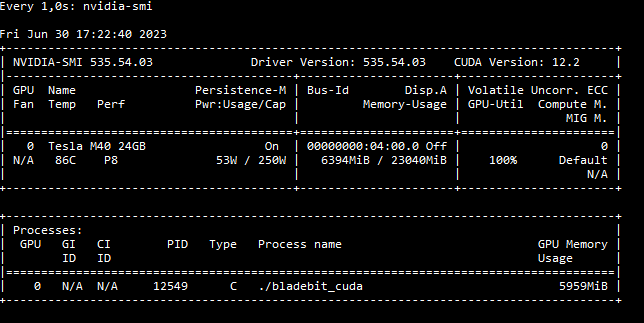
1 x Nvidia Tesla M40 (24GB, GDDR5)
The following SystemCPU side I have installed only one for now. I also monitored the process… CPU sided there is never a big need for as. Mostly only one CPU is needed. At the very beginning I have all 24 at 100% for 2-3 sec.
I THINK that CPU is not the problem here.
NVME.
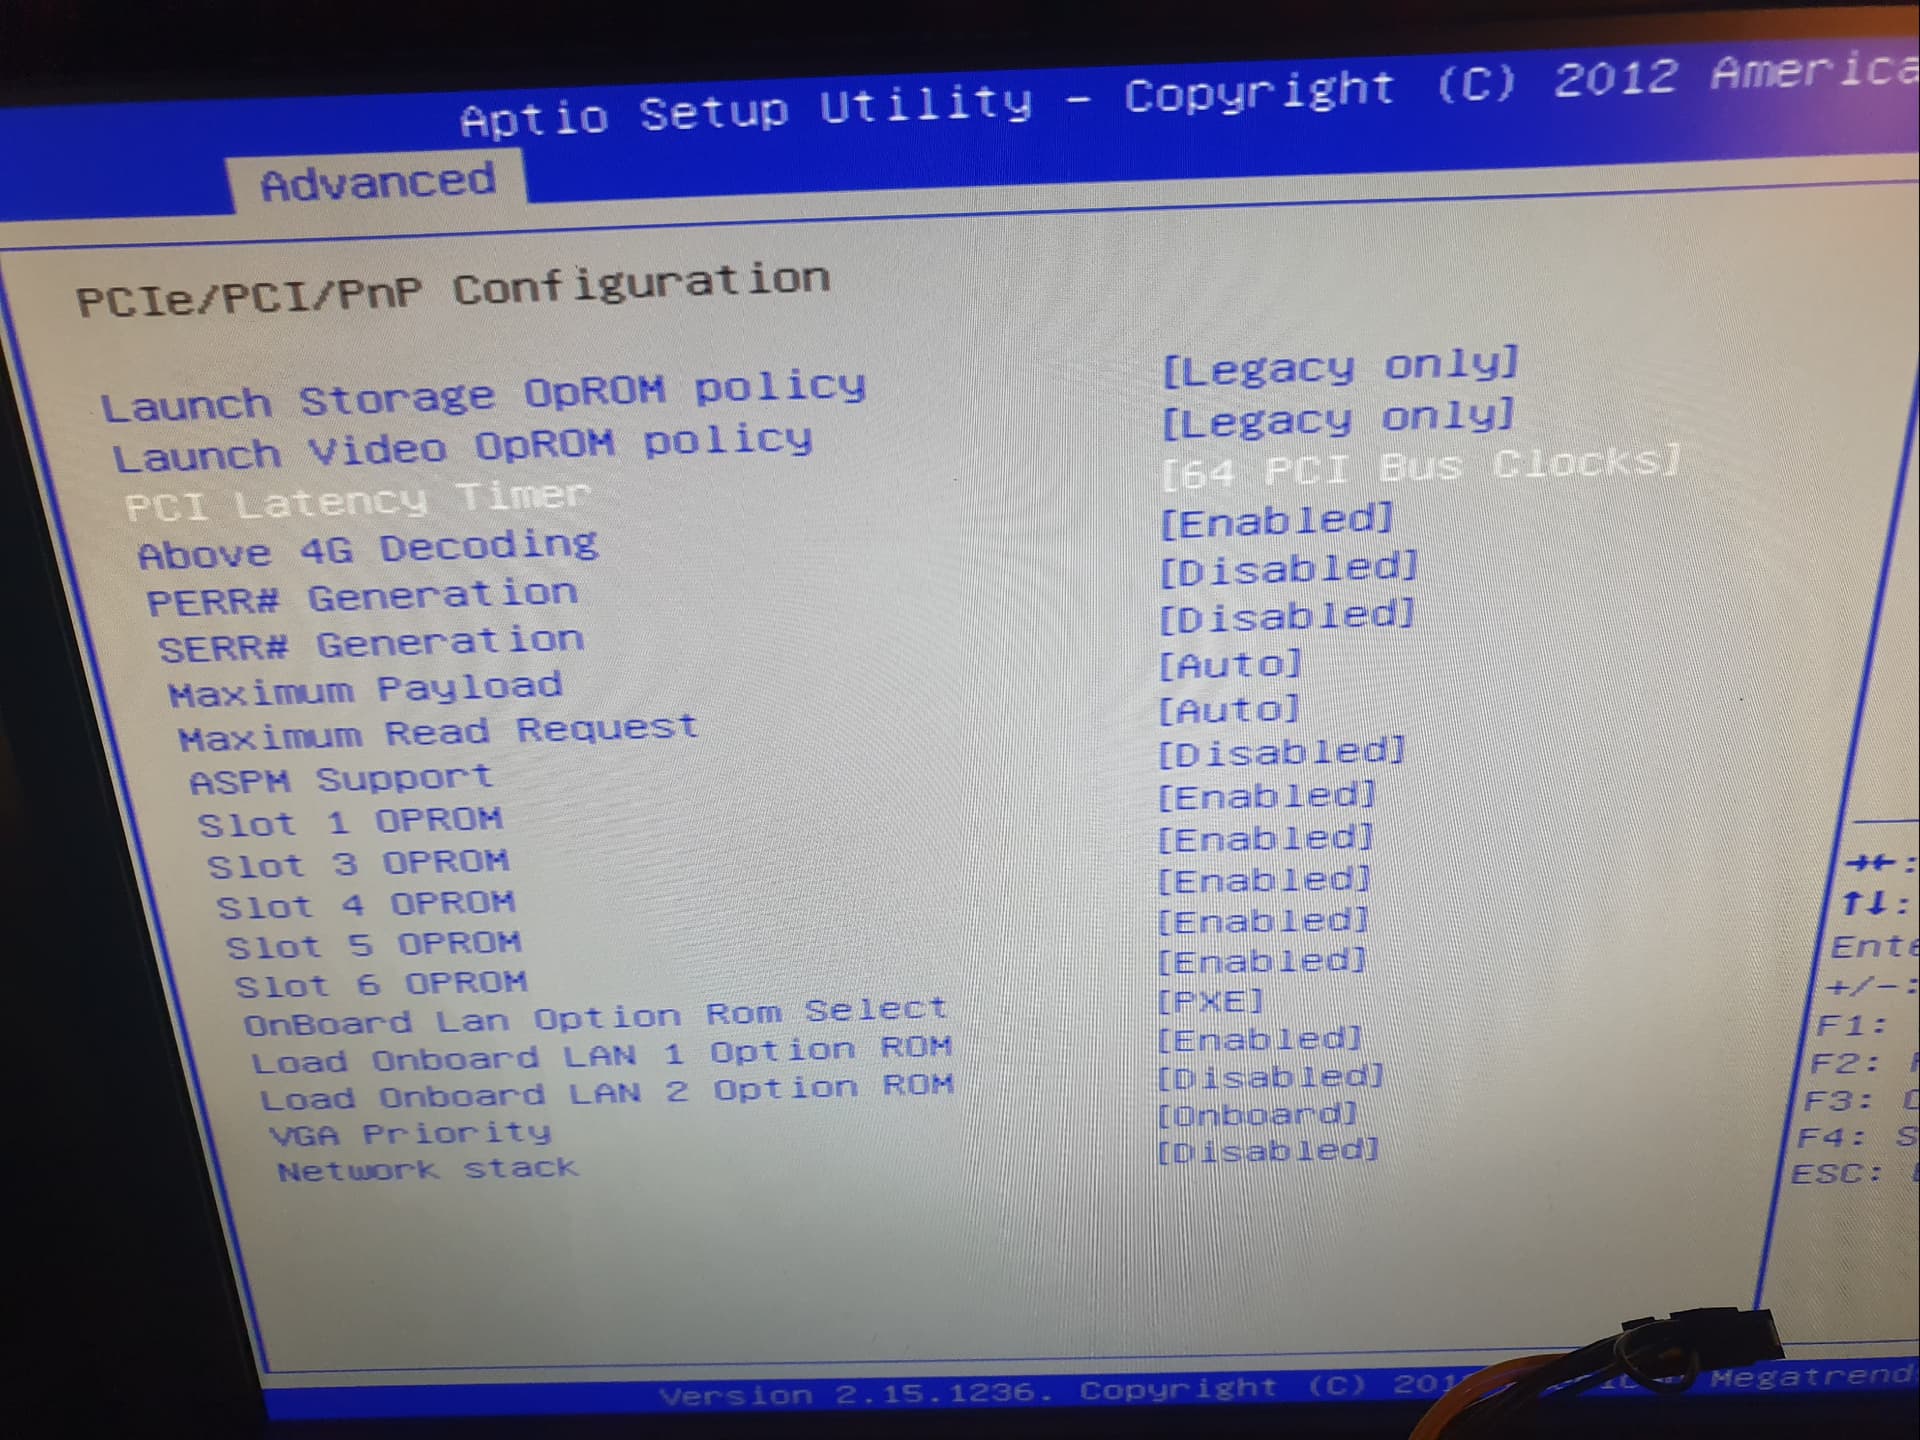
There could be a problem here. I have CPU 1 only in it.
So I have only 1x 16x PCIe and 2x 8x PCIe available.
The MB has no separate NVME slot. I use a PCIe to NVME adapter.
But this should be unproblamtic, because PCIe x8 3.0 can do up to 7,8 GByte/s.
But the NVME can only do 4.4 GByte/s.
Thus, only the Tesla GPU remains.
Should it really be that bad?
Anbei die Daten. Plot 2 war fast identisch
Completed Plot 1 in 1961.25 seconds ( 32.69 minutes )
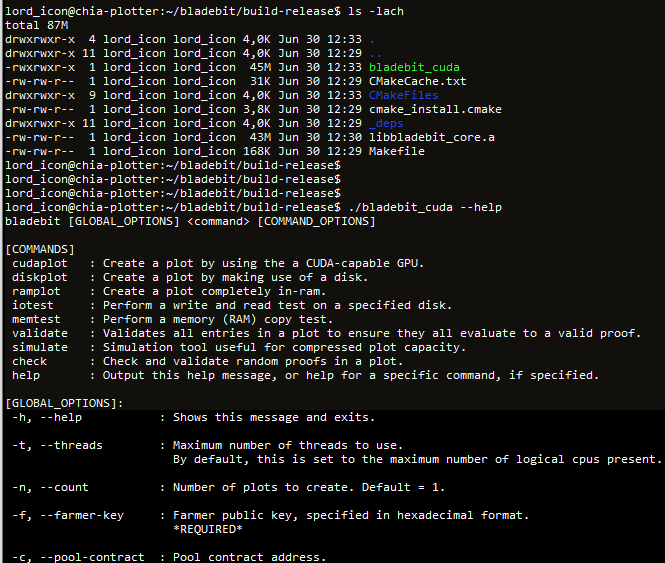
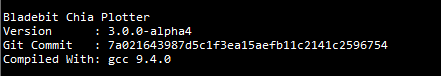
Bladebit Chia Plotter
Version      : 0.0.0-dev
Git Commit   : unknown
Compiled With: gcc 11.3.0

[Global Plotting Config]
 Will create 10 plots.
 Thread count          : 24
 Warm start enabled    : false
 NUMA disabled         : false
 CPU affinity disabled : false
 Farmer public key     : 12345
 Pool public key       : 678910
 Compression Level     : 7
 Benchmark mode        : disabled

[Bladebit CUDA Plotter]
Selected cuda device 0 : Tesla M40 24GB
 CUDA Compute Capability   : 5.2
 SM count                  : 24
 Max blocks per SM         : 32
 Max threads per SM        : 2048
 Async Engine Count        : 2
 L2 cache size             : 3.00 MB
 L2 persist cache max size : 0.00 MB
 Stack Size                : 1.00 KB
 Memory:
  Total                    : 22.40 GB
  Free                     : 22.30 GB

Allocating buffers (this may take a few seconds)...
Kernel RAM required       : 90240524288  bytes ( 86060.07  MiB or 84.04  GiB )
Intermediate RAM required : 2999001088   bytes ( 2860.07   MiB or 2.79   GiB )
Host RAM required         : 141733920768 bytes ( 135168.00 MiB or 132.00 GiB )
Total Host RAM required   : 231974445056 bytes ( 221228.07 MiB or 216.04 GiB )
GPU RAM required          : 6135058432   bytes ( 5850.85   MiB or 5.71   GiB )
Allocating buffers

Generating plot 1 / 10: 2118da2930ac20c42bdc76a839ecdb0325ae021bd88c52a5ff9eae433fd69b04
Plot temporary file: /mnt/NVME/plot-k32-c07-2023-06-30-13-38-2118da2930ac20c42bdc76a839ecdb0325ae021bd88c52a5ff9eae433fd69b04.plot.tmp

Generating F1
Finished F1 in 11.88 seconds.
Table 2 completed in 78.34 seconds with 4294902713 entries.
Table 3 completed in 120.91 seconds with 4294899439 entries.
Table 4 completed in 122.55 seconds with 4294851516 entries.
Table 5 completed in 132.00 seconds with 4294707013 entries.
Table 6 completed in 123.78 seconds with 4294461867 entries.
Table 7 completed in 107.23 seconds with 4293843262 entries.
Finalizing Table 7
Finalized Table 7 in 52.83 seconds.
Completed Phase 1 in 749.52 seconds
Marked Table 6 in 137.69 seconds.
Marked Table 5 in 112.64 seconds.
Marked Table 4 in 106.85 seconds.
Marked Table 3 in 104.69 seconds.
Completed Phase 2 in 461.87 seconds
Compressing Table 2 and 3...
 Step 1 completed step in 17.28 seconds.
 Step 2 completed step in 70.39 seconds.
Completed table 2 in 87.67 seconds with 3439821562 / 4294899439 entries ( 80.09% ).
Compressing tables 3 and 4...
 Step 1 completed step in 15.83 seconds.
 Step 2 completed step in 43.54 seconds.
 Step 3 completed step in 84.99 seconds.
Completed table 3 in 144.36 seconds with 3465962938 / 4294851516 entries ( 80.70% ).
Compressing tables 4 and 5...
 Step 1 completed step in 17.22 seconds.
 Step 2 completed step in 44.14 seconds.
 Step 3 completed step in 86.84 seconds.
Completed table 4 in 148.20 seconds with 3532684493 / 4294707013 entries ( 82.26% ).
Compressing tables 5 and 6...
 Step 1 completed step in 17.48 seconds.
 Step 2 completed step in 45.79 seconds.
 Step 3 completed step in 91.54 seconds.
Completed table 5 in 154.80 seconds with 3713096457 / 4294461867 entries ( 86.46% ).
Compressing tables 6 and 7...
 Step 1 completed step in 17.38 seconds.
 Step 2 completed step in 50.90 seconds.
 Step 3 completed step in 107.51 seconds.
Completed table 6 in 175.78 seconds with 4293843262 / 4293843262 entries ( 100.00% ).
Serializing P7 entries
Completed serializing P7 entries in 37.38 seconds.
Completed Phase 3 in 748.21 seconds
Completed Plot 1 in 1959.61 seconds ( 32.66 minutes )

/mnt/NVME/plot-k32-c07-2023-06-30-13-38-2118da2930ac20c42bdc76a839ecdb0325ae021bd88c52a5ff9eae433fd69b04.plot.tmp -> /mnt/NVME/plot-k32-c07-2023-06-30-13-38-2118da2930ac20c42bdc76a839ecdb0325ae021bd88c52a5ff9eae433fd69b04.plot
Completed writing plot in 0.10 seconds