Hello, I used to require 12 minutes for each plot with my plotting machine, but after two days, the time increased to 30 minutes. I reinstalled my operating system, but it didn’t have any effect.
My Machine
Dl380e G8
Cpu 2X 2430L
128G Ram
1TB NVME
RTX 3070 (install with 16X riser)
Ubuntu 22.04
Probably the NVME drive, is trim enabled and working?
You’d also be better off putting another 128GB of ram in that server, and then use full ram mode.
1 Like
My solution is to use several cheap SAS mechanical hard drive as RAID 0. It flies.
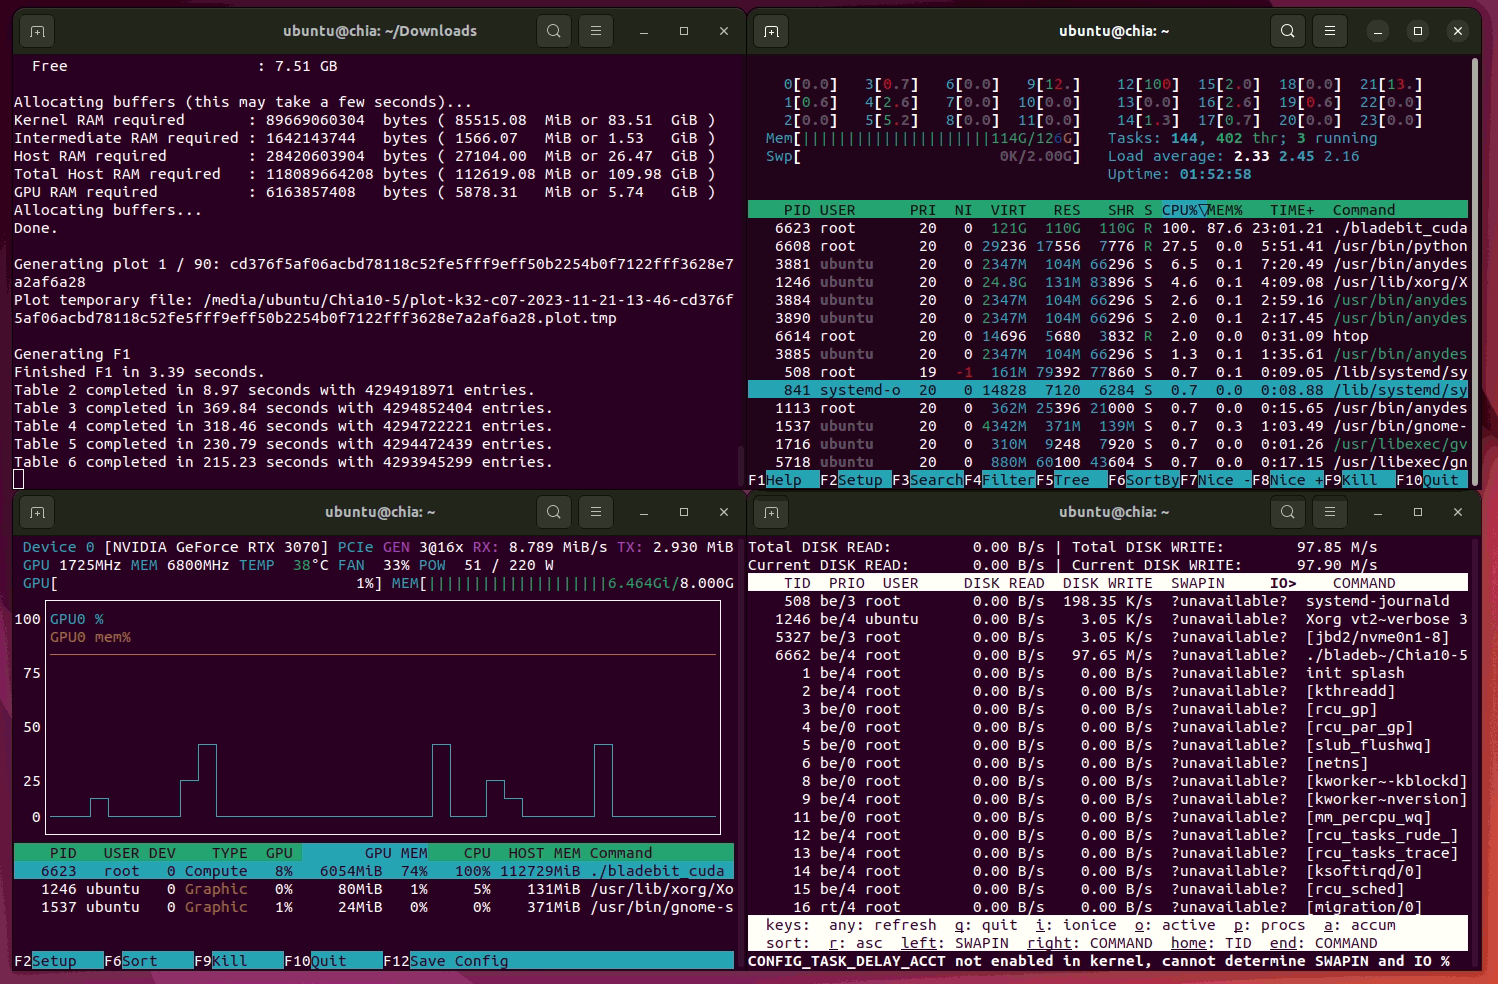
by the way, what GPU monitoring software you use?
Looks like nvtop to me.
Thank you for the response. Yes, the NVMe is working, but the GPU is not performing well.
The GPU may be held back by an underperforming NVME drive.
tnq for answer. I use raid0 for all sas hard drive and using nvtop for monitoring
To test this issue or find a solution, is there any way?
Make sure that trim is enabled - I believe you need to add discard when you mount the NVME drive.
Try a different drive, or the best option install 256GB ram, it won’t cost much for that server.
I think that trim is rather highly overrated. It has some impact if small bits of data (single bytes - under a Flash Page of data) are being constantly written (e.g., normal OS drive, small temp / text files). However, during the plotting, whole pages are written to Flash, thus trim overhead is rather negligible.
At least, that is my understanding of trim. Also, when I played with it during the plotting (MM, GH plotters), I hardly saw any differences (if any at all).
On the other hand, Flash is sensitive to high temps, so a good NVMe heatsink, and an extra fan (60mm) can make a big difference (e.g., Samsung NVMes run hot). As you mentioned, a different (better) NVMe would be worth to try. Also, it would be worth to check on RAM temps.
By the way, bpytop (when it has a good day) shows NVMe and HDs IO. Also smartctl (or something else) can be used to check NVMe temps. I used psensor (Psensor Sensor Monitor in Linux: A Hardware Monitoring Tool [GUI]) to monitor my Ubuntu box during plotting (but it can be painful to install).
i use this command for check TRim <hdparm -I /dev/nvme0n1> and dont see any information of nvme
If you run iotop as root in another window it should be easy to see if the nvme is slowing down
Read about NUMA and QPI, bus between CPUs is not so wide, to send data quickly. Could be a bottleneck.
The GPU might also have overheating issues that develop over time and reduce it’s clock rate.
Run nvidia-smi to monitor that, with the -l option (I normally use -l 5 but any number between 1 and 10 should work fine).