Bladebit cuda simulate

I can not run the “ bladebit_cuda simulate “ command. Can you please explain to a noob on this subject.

Shall I use powershell or cmd.exe in windows 11? Tried both with no luck.
What is the input whole line?
Shall I copy a test plot to the same directory with bladebit_cuda.exe ?
I can not show the path to the plot file. Tried / or .
The file says unknown command -f (filter).
The example command lines some have prefix ./ some don’t have?

bladebit_cuda simulate -n 1000 -f 256 c:\plotfile.plot

./ is for powershell / linux
Cmd doesnt use it

For the plotfile, need to use full path and also .plot at the end. Plot needs to be on ssd for good result.

What is the command you are using now?
Makes it easier to troubleshoot

Thank you for answering me. It works now. Its OK.
Now its time to learn how to understand the results of the simulation.
It says:
Error 1 while fetching proof for F7 2842269055
Error 1 while fetching proof for F7 3281506909
Error 1 while fetching proof for F7 2128746760
Proofs/challenges: 1029/38 ( 2707.89 % )
Fetches/challenges: 660/38
Filter: 256
Effective partials: 16 (2.47%)
Total fetch time elapsed : 146.516 sec
Average Plot lookup time: 0.242 sec
Worst: 3.206 sec
Average full proof lookup time: 1.695 second
Fastest full proof lookup time: 1.060 sec.

bladebit_cuda simulate -n 1000 -f 256 —power 360 size 620TB C:\……\plot-k32-……plot

So shall I be OK to pass the filter with 620TB space? Or do I need more test with different settings ?
Do I need to enter thread number? (İ7 8 core 16 threads)

1 Like

When you find out please send me some text to explain, so we both will know…

the error 1 IIRC, not an issue, just happens sometimes.

Your proof times look absolutely fine, but maybe run the simulate without the power and size options, or run it for a bit longer, like 10 minutes.

Proof time needs to be under 28 sec…so you got some room there.
Though for good measure, I think most people would like to be below 5 sec average still.

1 Like

That recommended 5 secs is from times where there was no compression. Therefore, I think it is not really feasible to recommend it for those that have compressed plots.

My understanding is that all is OK if proofs are around or below 8 secs right now (new recommendation?). For my farm, having proof lookups around 7.5 secs, I see a couple of proofs around 18-20 secs, and about handful around 12-14 secs. As you mentioned that the max is 28 secs, it may be that the avg could push the avg by another 2-5 secs and still be below 28 secs. The worst thing is that GPU will get from time to time congested, and a couple of proofs will fail. Most likely the loss will still be smaller than from the missing signage points.

I also think that right now it is also important to watch the GPU utilization to not max it out (as the number of proofs found per slot will fluctuate, leading to a spillage of GPU load to the next slot/proof-check).

I guess, the bottom line is that that 5 secs before represented basically the HD access issues / load, where right now there is also the GPU load component needed to be considered (both point to different issues).

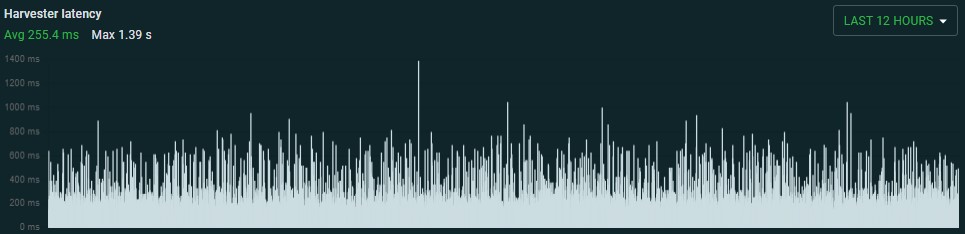
By the way, here is an example of my lookup times:

:mag: Searches:

  • total performed: 9237
  • average: 5.50 sec, min: 0.43 sec, max: 13.35 sec

– 0-1 sec: [X_________] 0.15%, 14 occasions
– 1-2 sec: [X_________] 0.09%, 8 occasions
– 2-3 sec: [X_________] 2.10%, 194 occasions
– 3-4 sec: [XX________] 10.96%, 1012 occasions
– 4-5 sec: [XXX_______] 25.31%, 2338 occasions
– 5-6 sec: [XXX_______] 27.71%, 2560 occasions
– 6-7 sec: [XXX_______] 20.17%, 1863 occasions
– 7-8 sec: [X_________] 9.20%, 850 occasions
– 8-9 sec: [X_________] 3.11%, 287 occasions
– 9-10 sec: [X_________] 1.02%, 94 occasions
– 10+ sec: [X_________] 0.18%, 17 occasions

The average on that harvester was 5.50 secs (based on logs, but it correlates with GPU load). However, my pool reports it as ~7.5 secs. I am not sure where that extra 2 seconds is coming from. If I recall, the GPU is running at around 70%, but I still see some GPU load spillages when there are more proofs found.

A question may also arise - how important is a quick answer?
I understand that it is probably better to have more plots (compression) to increase the ability to pass the filter and participate in “matching” - but maybe speed is also important?
I know that in the case of similar data, the reward can be multiplied on one block - but how do we know how long our data needs to travel through all the nodes in the global network?
Maybe in the increasingly large ocean of compressed plots, sometimes good old plots, with their “fast” answers, have a bit of an advantage?

Here are my hardware details:

Networking speed (network propagation) is really nothing compared to decompression, HD access, pool overload, etc., so really no need to worry about that part. As you have discovered, even with your low latencies you pushed 10x bad luck, what would imply that I would have to see 100x bad luck, if those “things” were real. A protocol is a protocol, it doesn’t have emotions. No need to fear unknowns.

What I wanted to illustrate is that with uncompressed plots the lookups are close to averages and the bias comes usually from controllers, therefore any bigger deviation implies individual HD problems. On the other hand, with compressed plots, lookup variations are amplified by the decompression times, and it would be rather expensive and pointless to try to maintain low lookup times.

By the way, take a look at a few biggest farmers in your pool and check their lookup times. If those long lookups would be a thing, those pools would be running really badly as those big farmers are winning the bulk of blocks.

By the way, to better understand why the network propagation is irrelevant, let’s assume that we have a perfect network, where every node has 11 peers, and those connections don’t overlap. That implies that in 5 hops a packet can reach 100k nodes (about the size of the netspace). Also, we know that a round trip (ping) across the world is 200-300ms, so the farthest node will be reached in about 150ms (excluding node handling). We can factor in 0.5 sec node handling delay that gives us 2 sec total delay (5 hops). So, in 2 sec + 0.150 sec the packet is delivered everywhere.

1 Like

Still average should be quite low imo

I mean my average is 2-3 second, but still with spikes to 15 or even 20 sometimes.
If your average is too high, it becomes more likely to have late partials or lookups.

In any case, I like to stay well below the limit.
But you are right that there is quite a bit of room.

That’s what I thought too - at least my analytical part of my mind.
Although my soul would like it, low times would have some meaning in terms of “in plus” for me.
Thank you, Jacek, for your detailed explanation - but at the same time understandable to me as a non-IT person.

And as for ping…
I remember the old days and the first version of the Quake game.
This was my first contact with servers dedicated to games. In those days, with 64 kb/s connections, there were days with a lag of 400-500 ms and then it was impossible to play such a dynamic game… Old times…

Good old ISDN lines I had a 128k to my house in 1994 that my company paid for. Was better than dial-up.

My start was with USRobotics14.4k with V.32 and V.42 (bis).
I’m not talking about BBS (but it was already at my friend’s - I couldn’t afford such miracles back then - I was young and without funds) :wink:
Long ago…
Does anyone here even know what we’re talking about?

I had a Radio Shack 110 baud modem back in 1982, and built a circuit that used the RTS line to toggle a relay to dial. A programmer who wrote a comm program for the Radio Shack Model-1 toggled the RTS line from a dialing menu.
.
Something like this
image

I’m still using this:

It works fine. No need to upgrade. My Chia response times are fine.

2 Likes

In 1982, I was just starting elementary school.
I had a primer book and I was wondering why I had to leave my teddy bear at home :wink:

Back in 1982 I could see what I was soldering :rofl: :rofl: :rofl: :rofl:

2 Likes

I played the original Doom multiplayer with my brother, we connected our computers with coax and BNC connectors IIRC.

My video card was a 3Dfx Voodoo II, I also remember paying a small fortune for 128MB stick of ram!!!

And yes, my eyesight was much better back then as well.

I think that the lookup distribution shape and CPU/GPU loads are more important than averages for compressed plots (Anscombe’s quartet or datasaurus dozen, if that rings a bell).

Those are my outliers from yesterday (lookup avg is ~7.5s):

[2024-03-05 10:14:32] [ WARNING] --- ⚠️ WARNING: Seeking plots took too long: 12.01 seconds!  Eligible plots: 47 (quick_plot_search_time.py:80)
[2024-03-05 14:37:07] [ WARNING] --- ⚠️ WARNING: Seeking plots took too long: 12.03 seconds!  Eligible plots: 42 (quick_plot_search_time.py:80)
[2024-03-05 14:37:42] [ WARNING] --- ⚠️ WARNING: Seeking plots took too long: 12.32 seconds!  Eligible plots: 36 (quick_plot_search_time.py:80)
[2024-03-05 18:26:57] [ WARNING] --- ⚠️ WARNING: Seeking plots took too long: 12.03 seconds!  Eligible plots: 41 (quick_plot_search_time.py:80)
[2024-03-05 19:46:36] [ WARNING] --- ⚠️ WARNING: Seeking plots took too long: 13.61 seconds!  Eligible plots: 46 (quick_plot_search_time.py:80)
[2024-03-05 20:56:53] [ WARNING] --- ⚠️ WARNING: Seeking plots took too long: 14.95 seconds!  Eligible plots: 48 (quick_plot_search_time.py:80)

My avg eligible plot count is 20-25, so those where really lucky challenges.

If your outliers are that high (14-20s) where avg is 2-3s, maybe that depends on difficulty level (too low for your farm), assuming you are pooling and can set it either manually, or let it float?