Hi there, I just wanted to share a tool I created that I thought others might find useful:
It’s a cross-platform command line tool that parses through a directory of your plotting log files and generates a .csv file (which you can open as a spreadsheet) containing all the main data points recorded in each file (there’s a list of which ones on the GitHub page).
I tried to keep it simple and user-friendly but if you’re interested in trying it and my instructions weren’t clear enough let me know and I’d be glad to help!
Nice tool! I’m just having a problem running the Windows version. I put the .exe in the Chia folder that contains all the .plot files. After running on the directory “/” and output: export.csv I get a working CSV, but it’s empty. Am I doing something stupid? I see the commandline scanning the plot files, so the directory should be correct. I tried more than one version (full path, dir path, network path, root path, etc)
Looks like this (plain-text version).
Plot size,Buffer size,Buckets,Threads,Stripe size,Start date,Phase 1 duration,Phase 2 duration,Phase 3 duration,Phase 4 duration,Total time,Plot filename,
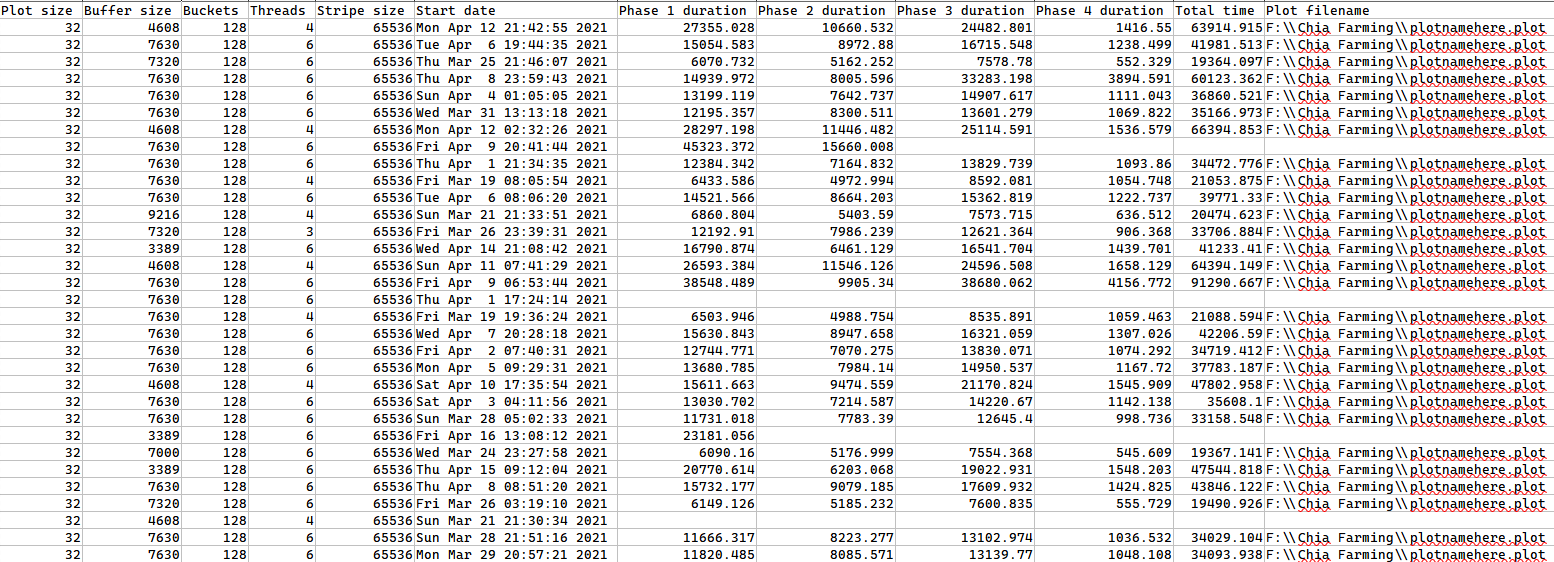
Here’s an example of the raw output opened as a spreadsheet (unlike this example the plot filenames will all be unique but I changed them for security reasons):
For me, the main draw of presenting the data this way is that you can see a breakdown of the duration of each phase for each plot. You could then, for instance, calculate the average duration or determine if there’s a correlation with duration and your settings for buffer size or threads.
My guess is that if you put the .exe in the folder with your plot files the input path should be . instead of / but I also did not account for running the application from the folder that it’s reading files from so you may want to execute the application from a different location in case it’s trying to read itself. Otherwise it sounds like it’s running normally since you’re getting the header line output.
So I’ve run the .exe from another folder, put in V:\ as the source (this is where my plots are on the network share). They are being found.
A CSV file is being generated but still 1kb with only the header. Looks like parsing is working, but the export to CSV is doing something weird.
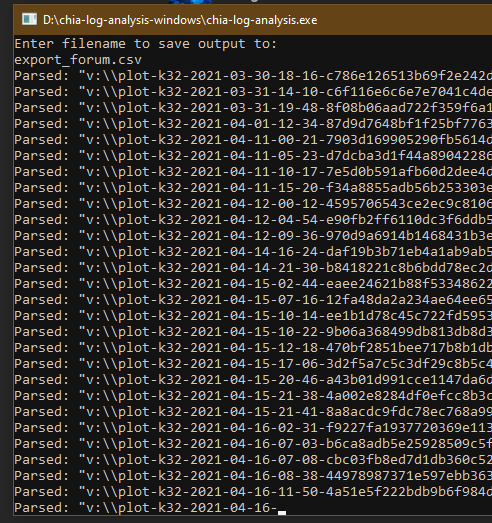
Thanks for the info, I have a new version with better feedback during file parsing in the works and should have it available tonight.
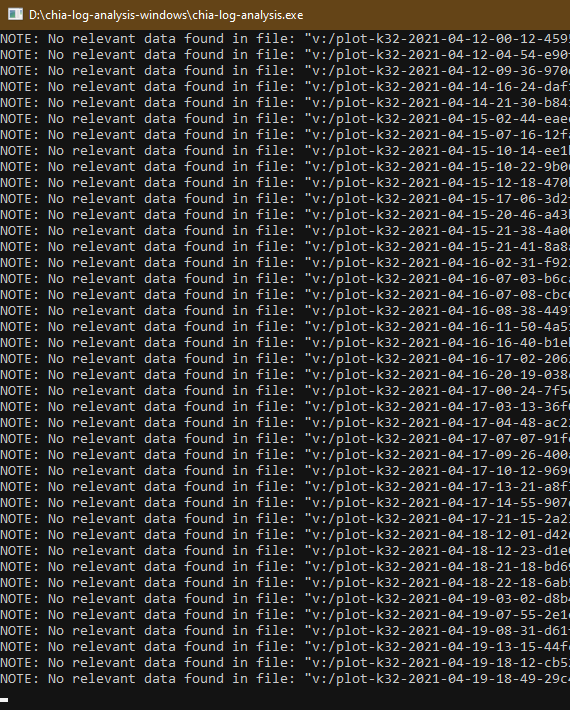
In the meantime I suspect the issue is either that the application is unable to open the files (although the output Parsed lines imply the opposite, this will be changed in the new version) or is unable to find any relevant data (there will be clear output if this happens in the new version as well).
My only thoughts right now are that it could be an issue with file permissions for the input files or an issue related to the files being on a mapped network drive.
Thanks for the info, yes your post did make sense! I tried to replicate your setup of log files on a mapped network drive (suspecting that might be the issue) but it worked for me. Is the mapped drive on a Windows system or a different OS? My thought is maybe Windows is able to open the files but unable to read them for some reason, but I find that unlikely at this point.
The only other thing I can think of to try is if you could attach one of your log files (either here or on a GitHub Issue) I can confirm that the formatting matches up with what the application expects. I only have log files generated from plotting with the Windows GUI (since I do it on my gaming PC) so if you generated plots another way perhaps there’s a disconnect there.
Hey. Yes I am using Windows GUI for plotting and the Chia Log Analysis. Indeed a mapped network drive on a Synology (well, Xpenology) DSM system. It’s a shared folder that has read and right access.
I would like to add a log of a recent plot but I can’t see logs from plots that are done and now only have one that’s at 18%. I don’t know if there is another log you want to see?
The CSV file generated is this: Plot size,Buffer size,Buckets,Threads,Stripe size,Start date,Phase 1 duration,Phase 2 duration,Phase 3 duration,Phase 4 duration,Total time,Plot filename,
After filename there is still a comma, maybe it’s expecting another value that it cannot read?
Oh I see the issue now! It looks like you’re passing the application the location of the plot files themselves (file extension .plot) but the application actually expects the log files (file extension .txt)generated during the plotting process. The plotter saves those in a location like: C:\Users\Username\.chia\mainnet\plotter
If you point it to the equivalent location on your system you should be good to go!
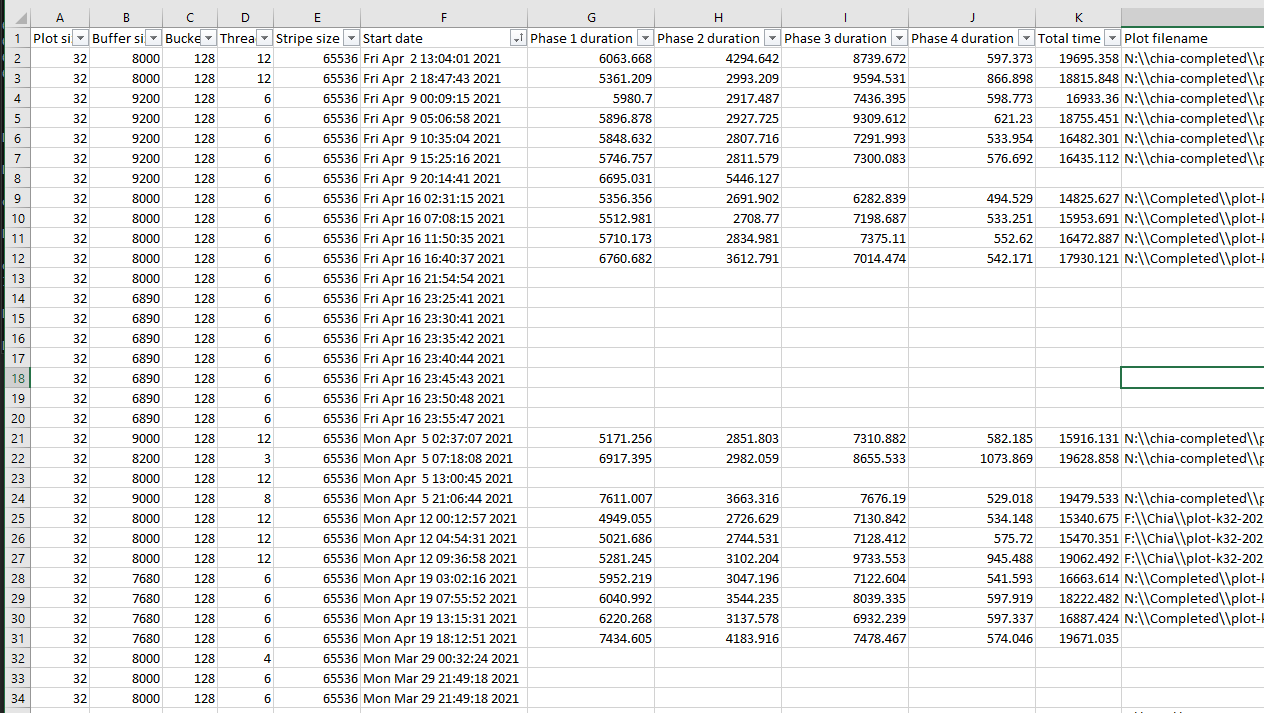
Ah I see. Dumb me! Now it’s working! I didn’t know I had to select the Chia log folder, I probably read it wrong, so I thought I needed to add the completed Plot directory. CSV is good now. Example how it looks in Excel after adding the sort function:
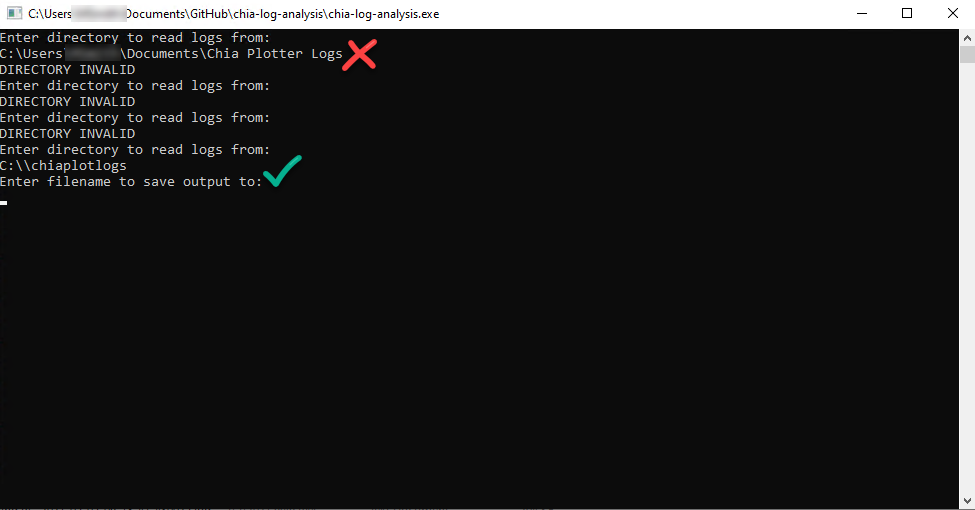
Hey Pengor! Thanks for making this tool. I was able to get a completed report into .csv format to see a report of all my plots, but I had to copy the logs from the directory that failed, & paste them into the directory that passed. What am I doing wrong when writing the directory that is in my Documents folder?
Hi there! It looks like the program doesn’t know how to handle the spaces in the name of your folder. I’ll see about fixing that for the next release but in the meantime your workaround is what I would recommend. Thanks for the feedback!