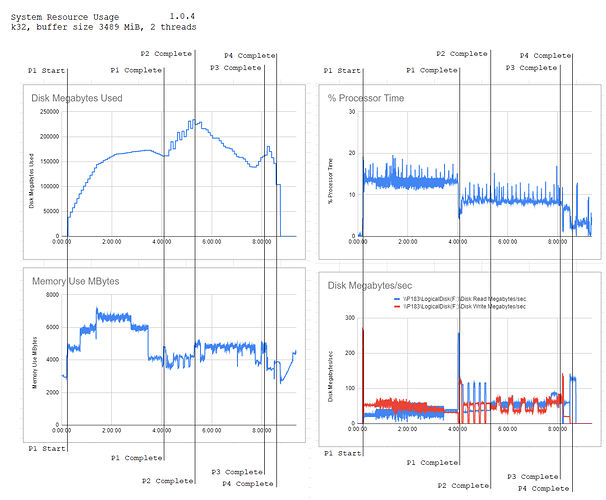
Adding to the descriptions, summarizing this excellent post by Aaron … let me know if I got this right:
| phase | goal | exercises | absolute % | total % |
|---|---|---|---|---|
| 1 | Generate lots of info | CPU heavy (multi-threaded) | 44% | 44% |
| 2 | Combine info into tables | RAM heavy | 57% | 13% |
| 3 | Compress to file | Disk I/O heavy* | 86% | 29% |
| 4 | Copy plot to final dest | Disk I/O copy | 99% | 13% |
(The total doesn’t add up to 100 because 1% of time is the setup and shutdown phases of the plot, I think. You can kinda see this on the graph as well; there’s a bit of time before phase 1 starts, and after phase 4 ends.)
Current wisdom as of 1.1.2+ is that the buckets and memory defaults are pretty much optimal; changing those params is highly unlikely to result in any improvements. I can say that my experiments here confirmed that adding memory does almost nothing for plot time.
* this is what the -2 second temp directory is supposed to help with
