Disk storage tool to plot space against time?

Hello.

Im using Ubuntu Server to plot and can keep an eye on the hard drive space whilst i plot using duf and du -h to keep an eye on things.

However, does anyone know of a tool to plot hard drive space against time and give me an output?

Other than me manually taking a note, say every 15 mins and writing it down.

Thanks in advance

W

I use monitorix. Its not great, but its simple and works well enough for this task.

monitorx looks capable.

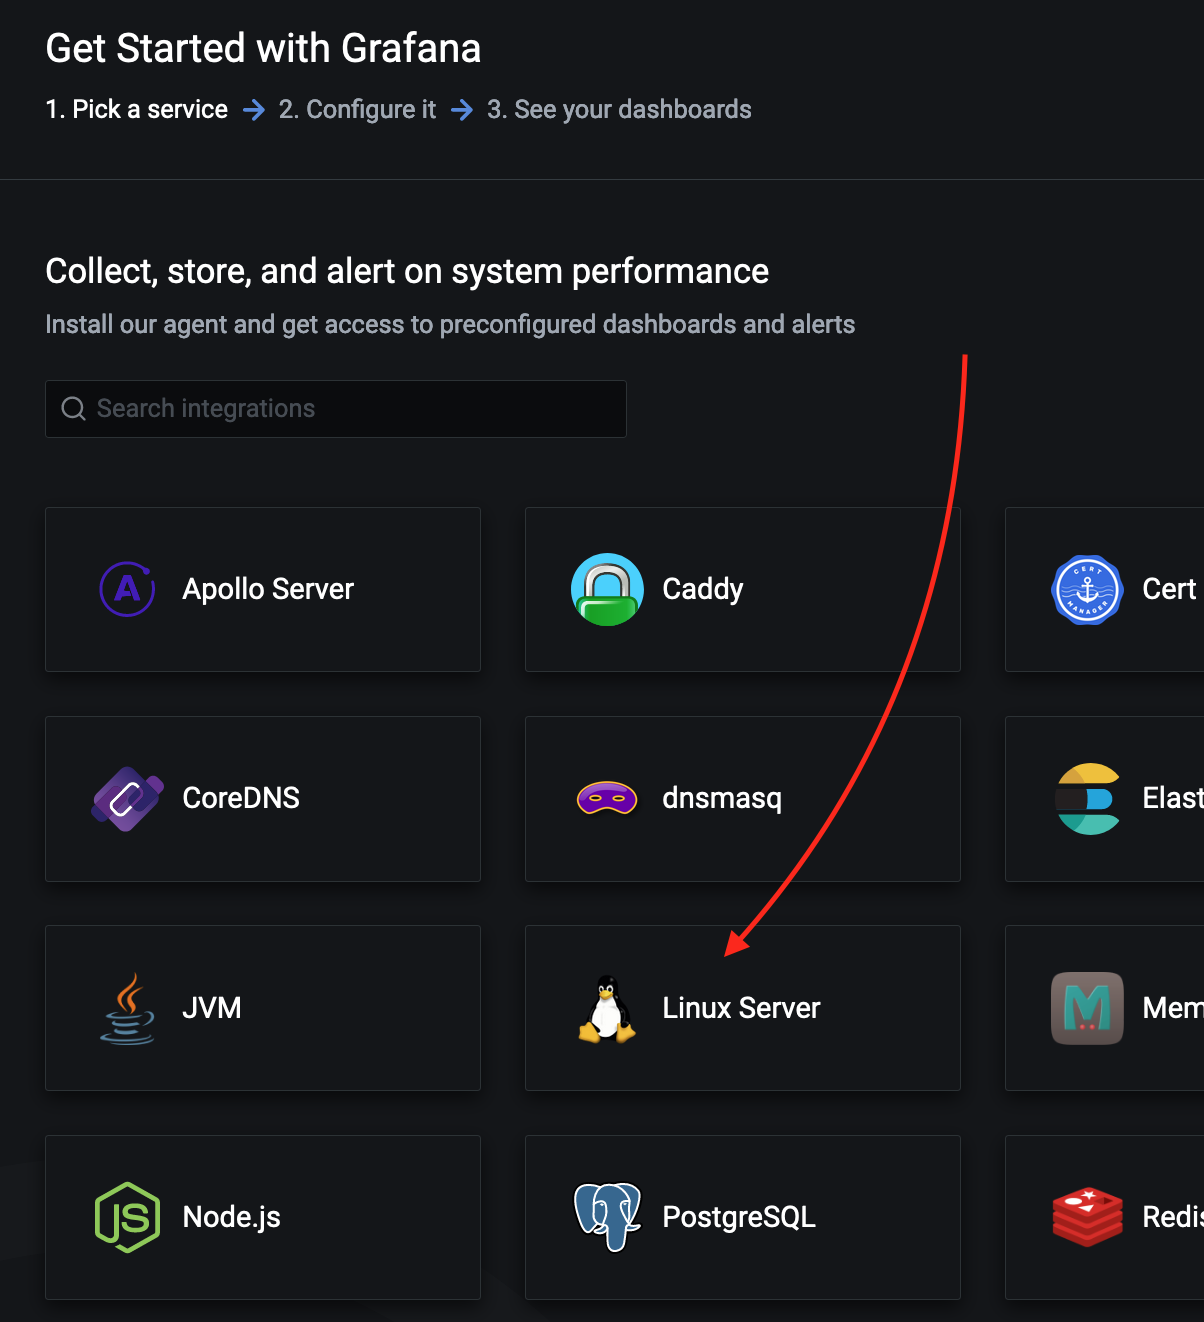
If you want to get fancier, it’s pretty easy to set up a (free) grafana clound account and install the basic host agent. During the onboarding, just pick the “Linux Server” option (and then select “Debian Based” for distribution), and paste the thing into a terminal. You’ll get a bunch of pretty graphs instantly.

Then you can waste weeks going down the metrics/graphing rabbit hole, if you’ve got nothing better to do. But getting pretty graphs of disk usage, IO, etc, over time takes all of 10 minutes to set up.

1 Like

I’ve installed monitorx but I can only see, for the moment, daily stats and I want stats whilst I plot, maybe every 5 mins.

I’ll have a look through the documentation and also look at grafana.

I’ll report back.

Slightly lost here Timdev.

Do i install Grafana OSS here:

An idiot’s guide would be good. Only a mild idiot mind you!

Don’t try to install grafana yourself (it’s doable, but you don’t need to).

They offer a generous free tier of their hosted service. The onboarding is pretty simple.

Then select “Linux Server” and follow the instructions (which are basically “paste this one command into your terminal”).

4 Likes

Ive managed to do that myself and can see the output from the ‘node’

Trouble is its showing everything but the ssd usage, which is what i want.

I can see Disk I/O for sdc (the relevant ssd) but not Disk Space, its showing that for sda (a hdd). Ill have to work out how to change that. It’s not the most intuitive thing though.

Thanks for you reply

There are two dashboards by default. You want this one:

Down at the bottom, you should see something like this:

Which is what I think you’re after.

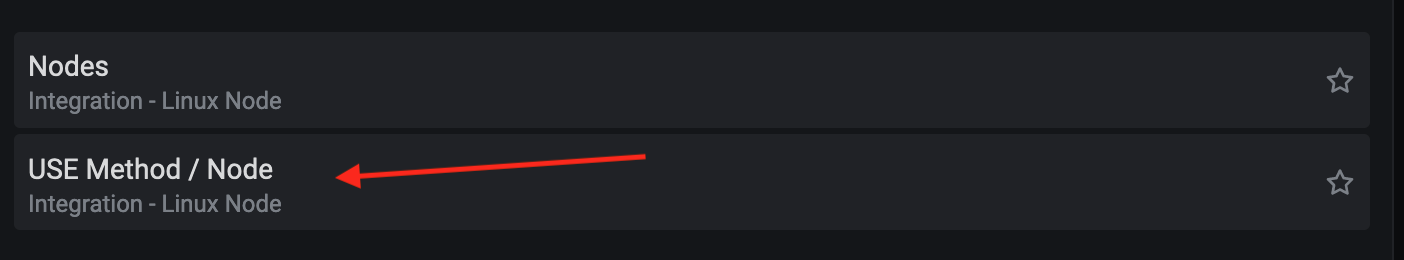
As I mentioned in my earlier comment, there’s a rabbit hole to go down here (if you want). It’s an incredibly flexible tool with a huge ecosystem of tools to collect various kinds of data. Some people have written collectors and dashboards specifically for chia.

But in your case, the default “USE Method / Node” dashboard should give you what you’re after with minimal time invested.

1 Like

Thanks @timdev

Ive just uninstalled monitorix

Thanks for your help. Ive no idea how to install that dashboard you linked to, im just learning Unix

But ill work it out.

1 Like

No problem. It can get fairly technical, and it’s probably not worth it to get fancy unless you’re already familiar with the tools. Or, go nuts and learn everything - you may find yourself a new career in systems administration :slight_smile:

1 Like