My main node is running the GUI. It says I have 112 plots in the Plot Count section, but I actually have 125 plots. It’s not showing the 13 plots I have on my other harvester.
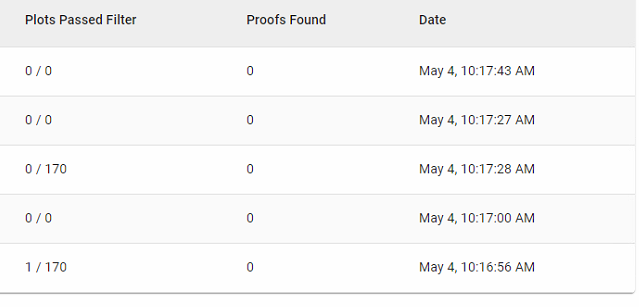
Also, in the “Last Attempted Proof” list, it shows both #/112 and #/13 in the “Plots Passed Filter” column. So the main node is seeing the harvester.
Anyone else experiences this? Is this a bug? Did I misconfigure my setup?
I am seeing the same in the GUI as I have a different machine where I plot but it’s set as a harvester as well with harvester started. Once the plot is done, in the GUI I still see the old Plot Count, but in the Last Attempted Proof I am seeing the GUI count + the remote machine.
My numbers are low so I just move the remote to the GUI location as I am freaking out if they are not actually used properly.
Sorry not much of help here, but wanted to confirm I’ve experienced the same. Too lazy/busy to investigate further
Theres 3 dots next to the add plots. and add the disk where u have those plots locate in. and after that scroll down to the page… usually they might appear there with something like plots unavailable and warns u if u delete em u might not recover them… and if u see ur plots there, just reload… the gui might stuck on connecting to wallet page… so its better to do it after u have done all ur plotting processes before u do anything…
I solved the issue by using the machine for plotting with the powershell (plotmanager) and the farming machine with the gui ^^ it’s maybe not the best but it work
Pretty sure what you’re talking about is a known issue… The gui / main node does not reflect remote harvester plots. i.e. my main node shows 0 plots, despite having close to 700 being actually farmed through remotes. There’s an open issue on github, will be added to a future version of chia.
If you’re checking the logs and seeing results from the ‘farmer’ that it’s sending signage points to your harvester, and then receiving farming_info back from that peer, you’re good. I keep log tails open on both of my remote harvesters and the main node, so I can actively see everything’s working.