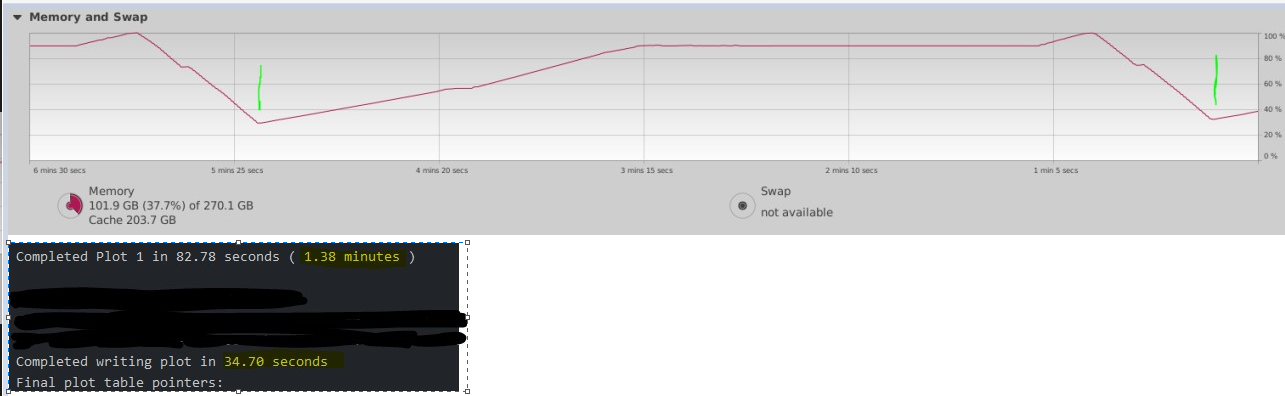
Does anyone have system plotting system profiles (memory, etc) that they could share? I feel like I may have a fundamental misunderstanding of how plotting works. My logs report a 1.95 min plot time but my memory usage (and plotman reports) indicate that my plot times are just over 5 min. (see attached picture)
Where does this discrepancy come from? Is there some process that is not included in the plot time calculations that is taking up 3 additional minutes? Hopefully it is something I can reduce.
I have BB plot time ~2.5 min/150s + 40-120s saving plot. I run python script to get average for at least 400 plots…it comes usually ~3.44min/207s RAM > final storage
why do you bother with some 3rd party stuff?
In Linux I see always 230+GB RAM used, that is what is reserved with first plot. I doubt RAM/swap is any indication of plotting time.