and when I plot 4 at once, I’m getting slow plot times - around 35K seconds.
I’m staggering the plots, so there is only ever 1 in phase 1, I’ve tried 2,4,6 threads - but they don’t seem to make a difference. I’ve also tried buffer sizes 3072 and 4600, neither seems to impact the plot times. (Oh, and I’m using the apple silicon build)
I’ve seen a couple of people in these forums that seem to have much faster speeds 20K with 4 plots at once.
I’ve disabled FileVault, I’ve made sure the temp dirs are excluded from spotlight.
plotting:
k: 32
e: False # Use -e plotting option
n_threads: 4 # Threads per job
n_buckets: 128 # Number of buckets to split data into
job_buffer: 3389 # Per job memory
Having said that, I’ve been doing some research tonight and as a result of others’ success I’ve set one M1 Mini to max 4 plots with more threads and RAM. Will report back.
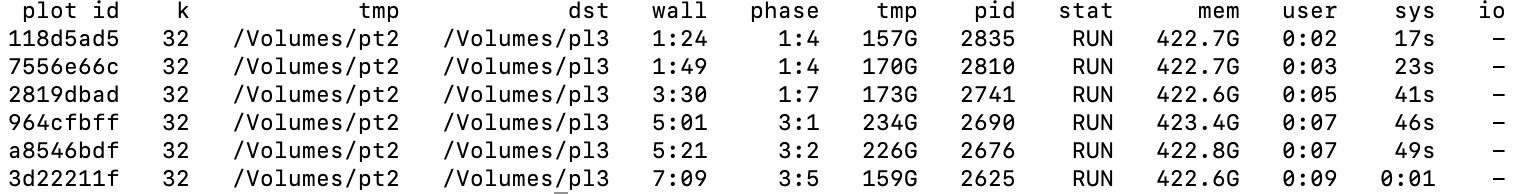
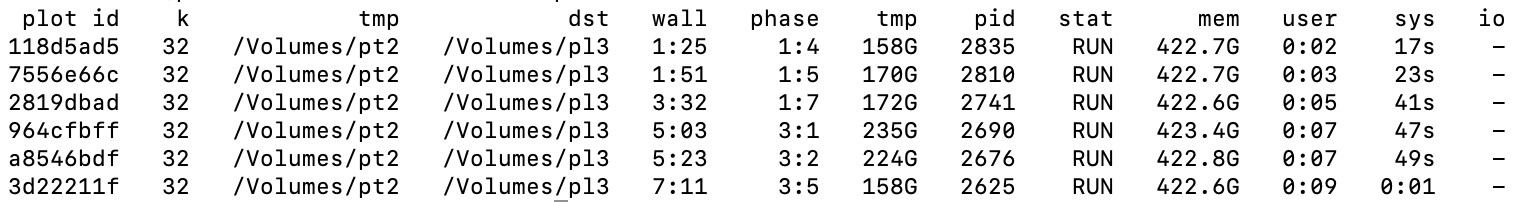
I have similar setup and considering adding second M1 with 16GB to work in conjunction with my existing M1 rig with 970 EVO Plus 2TB in Sabrent enclosure model EC-SNVE. I currently settled on 5 plots but will attempt 7 in parallel mid-week.
I’m using the native M1 plotter and each plot is set to use 4000 ram and 4 threads with 180min delay. My target is 5 plots in the morning, 5 afternoon, and 5 evening approximately 15 as target ~24 hours.
I’m curious how folks are handling the excessive heat? It seems to also be challenge. I wedged my NVMe in-between ice packs and tried fans too. Any other alternate suggestions?
System processes are probably being throttled, causing excessive writes and slowing plot times. You can check Activity Monitor during plotting to see what’s getting in the way. You could try a manual fan control app like TG Pro - Temperature monitoring & fan control to cool things down and reduce throttling.
Running natively using the git install rather than through Rosetta on the GUI could also speed things up for you a fair bit.
Okay, Thank you! It seems I also had a bottle neck with the previous cables. I mistakenly grabbed the 10GB enclosures initially instead of Thunderbolt 3 enclosures below: