Well, I have no idea what was wrong with my first run. I have only changed OC of CPU and that is it (also I have trimed my SSDs (Windows tool) and deleted about 300GB of old plots from SSD1, but I do not think this matters).
Trim and amount of free space on an SSD definitely can make a huge difference. May or may not have in your specific case but it can definitely be a big difference.
With the recent updates, on my 2990wx, I’m down to 1800s plot times with a 215s phase 4. When swar branch gets fixed to actually work and not having stuck PID’s, basically shaving off that full 215s, sub 1600s plots. Parallel my record was 50 per day so this is winning by nearly 10%
I tried to stagger a plot at the start of phase 3, it looks like the second plot phase 1 times were just as fast, but 192gb of ram isn’t enough, fills the ramdisk to the brim, pages the plot process. So you need 256gb of ram which means you could just set processor affinity and do 2 fully parallel… Or just have another completely separate plotter doubling output lol
I’m going to grab a 5950x soon, looks like it’s pretty typical to be 70 plots per day, sounds good to me!
With your ram at 4ghz, have you had to go 2:1 for your IF? if you have, you’d be faster at 3800 1:1
You would also probably be faster swapping the temp drives around. Mp600 has high cache write speeds, but slows to like 500mbps. Evo+ sustains >1500mbps.
So by the time you’ve finished a plot, the mp600 is super slow, for the temp2 drive you want super fast. But for temp1, it’ll probably be full speed, or close to it, for at least one whole plot.
I have activated all of them: PX profile, P2 profile and P1 profile. Also I have switched on CTR hybrid OC and extra boost.
CPU runs mostly at 100% utilization, thus P1 profile is mostly actived during plotting.
I believe you! What voltages did you end up using for that to be stable? My memory is 4000mhz CL18 but i haven’t bothered trying to get it to run at that because it’s seriously difficult.
One thing I am not sure was asked (at least I did not read it on the thread). Is dumping to the final directory interfering with plot times? I would imagine so. Does anyone have a staging drive set-up (NVME or regular SSD) to speed up the off load of the plot so the next plot can start?
So Mad Max helps both faster and slower rigs I guess.
I have a Ryzen 7 5800x and 2, 2T NVME and I was easily plotting 24 ( 3x 4 parallel plots on each NVME) plots a day with Chia plotter. with MAdmax I can do 30, 31 now.
on my older system ( Ryzen 5 2600, 1x 2T NVME) I was doing 10 plots a day ( 2x 5 parallel plots). now I can do around 14 a day
GREAT!
The worst for me was setting sub timings especially tRFC was just horrible. For some reason my memory does not like low timings thus I had to figure out higher frequency. I wanted to run 3600MHz, which is sweet spot IMHO, but I could not go under CL16. I have ended up with 4GHz CL 17 (original is 4GHz CL18 at 1.4V). Memory latency is at 56 ns (from AIDA 64) which is not that bad I guess.
My 3900x Windows plotter with 2x2TB EVO Plus does 2350 second plots (37 per day) with mad max, while with parallel plotting I could only squeeze out 31-32 plots per day after optimizing for two months.
But with putting 2 mad max plotters in parallel (kicking the second off after phase 1 of the first), and swapping temp1 and temp2 to better utilize the iOPS of both SSDs, I can do 4200 second plots (41 plots per day). Plot times differ in the beginning but incidentally they auto-balance until they start at the same subphase and finish times. This is a 30% improvement in plots per day compared to before, great!
But the most amazing result is a very old Xeon 2620 (6c/12t) workstation with slow 16GB DDR3 RAM and one 1TB 970 EVO (~$200 total system cost second hand). With 4 parallel through swar I was getting 7 or 8 plots per day, each taking ~12 hours to finish. But with mad max it is squeezing out serial plots every 6350 seconds, that is 13.6 plots per day; a 80% plotting speed improvement!
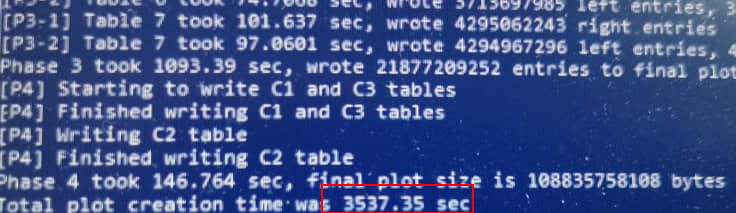
Madmax version 0.0.5 running in windows 10. Computer specs i7 core 10 edition (16 logical cores), RAM 32 GB (3600Mhz), NvMe Kingston KC2500 2TB. Running in a single power shell. The total plotting time is 3537 seconds (less than 1 hour). Bucket size 256 and 16 threads