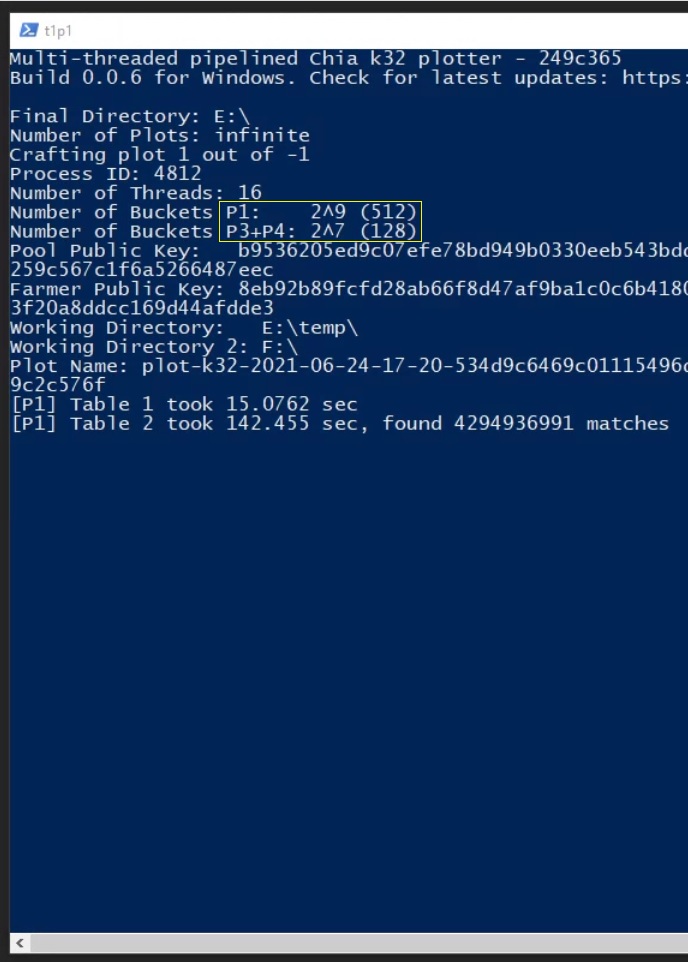
I’m using -u 512 and -v 64.
My P1 and P3 times are about the same, with P2 around 33% less than the other two.
With higher buckets for the whole plot or for P3/4 I was getting much longer P3/4 times.
I’m using -u 512 and -v 64.
My P1 and P3 times are about the same, with P2 around 33% less than the other two.
With higher buckets for the whole plot or for P3/4 I was getting much longer P3/4 times.
I have the TR Pro 64/128 using nvme no ramdisk and I get 2200s. I upgraded from a 16/32 and the time did not improve. I now run 4 in parallel. Windows just sucks and if you really want to use that system you will need to go to linux…
What worked, what did not work.
i9K (all 8 cores) OC-ed to 4.8 GHz - check
i9K (all 8 cores) OC-ed to 5.0 GHz - my 5-fan watercooling can’t keep it below 90C°
Memory RAM 3000 MHz OC-ed to 3733 HMz - check
Memory RAM 3000 mhZ OC-ed to 3800 HMz - no screen
That is quite rediculously slow, more than 10% slower than my 3900x on Windows with 25% of the threads… But I think your SSD is holding you back as it does not have high enough sustained write speed to keep up with your CPU and RAM. If you would replace your Firecuda 520 by just a single Samsung 970 PRO 1TB as temp1, and use OSFmount (free, fastest ramdisk software) instead of IMdisk to create the ramdisk for temp2, I think you should be able to get ~1200 second plot times.
This is probably unnecessary advice, but make sure to use a heatsink on your SSD, as well as a fan directed at your RAM if the modules are very near to each other in a 4x32GB setup. As temp throttling could hurt your performance!
You get 1200s plot time on windows??
With a change of 512 buckets for phase 1 and 2, 128 buckets for phase 3 and 4, temp 1 and 2 separate drives, I came down to 43 minutes
The whole “10 percent” faster on linux seems a bit outdated once Madmax came out. On the sloth tech google spread sheet you can see all the fastest times, and most plots per day are on Linux OS.
There is 1 Windows plotter with a TR setup that has hit 1300sec overclocking the hell out of his system. I had walked him line by line on setting up Ubuntu Desktop Live off a usb thumb drive and his first plot with no overclock and no optimization was 1290sec. With simple tweaking of filesystem on nvme it was at 1200sec. Finally with raid0 of 2 nvme he was plotting 11xx sec. I think his fastest is 1048sec. I’m sure if I helped him optimize it he would be sub 1000sec.
How do you change your buckets for just phase 3 and 4?
the “dash v” phrase for phase 3 and 4, like: -v 128
-u 512 (all phrase if -v is not specified, only phase 1 and 2 if -v “number” is added)
-v 128 (phase 3 and 4 only)
I setup an R620 with Ubuntu, got madmax compiled and setup tmpfs ramdrive.
Began plotting - P1 Table 1 was 15 seconds so I knew it was going to be fast, on my windows servers its more like 30-50 secondds, then it crashes out with an error about runtime something or other. Tried a few times, tries fewer threads in case I was strangling the operating system. Then switched back to windows, might give the Ubuntu-within-windows a go.
With cori7 10700
16 gb ram 2666
970 evo plus
Im getting around 82 min per plot and I’m realy disappointed
Can anybody help me
I think my problem is either cpu temp (75)
Or ram speed
Do you agree?
I had a similar issue, would crash at either P1-T1 or T2. After some restart and reformatting the drives it magically went away. No idea why though
I might give it another go that particular machine is very slow in windows.
Think the ram size (and speed) could be an issue.
75C for an i7 doesn’t seem like a real problem to me.
Should also look around if you can find some other ppl with similar setup to see what they are getting to get a sense of how far off you are.
Did you try different bucket settings yet?
Yes 82 minute is the best time
I tested different bucket number
512 and 256 is the best
Still I was hoping for 60 minutes
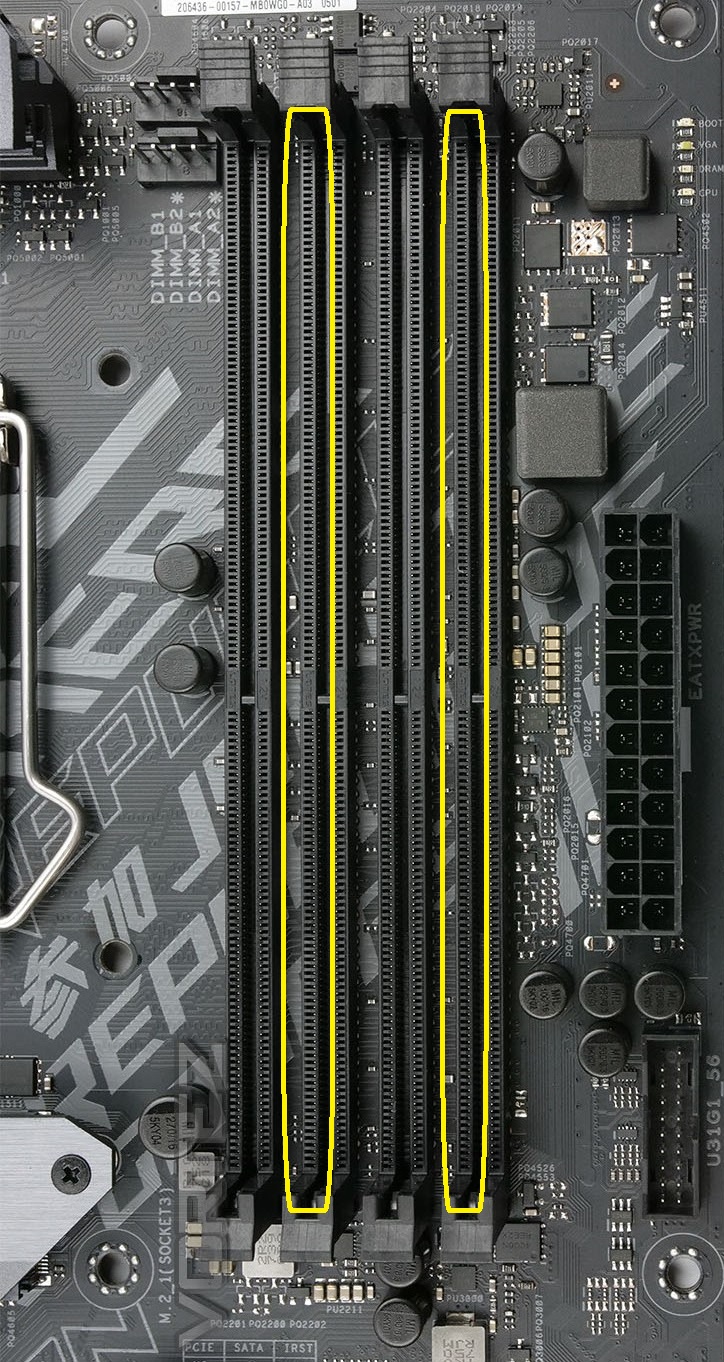
If this is not already the case, and if only with 2 RAM sticks, putting them into the 2nd and 4th lane from left improves the speed.
I’ve tried various buckets 512/128 512/64 both seem pretty good. I have done an 83 minute plot/5000 seconds so it can be done, copying to the network whilst plotting slows things down. I am also not using NVMES/SSDs.
I will have another go with linux, I got it all installed and basically figured out my way around it, I have had raspberry pi’s for a while so its not totally unfamilar.
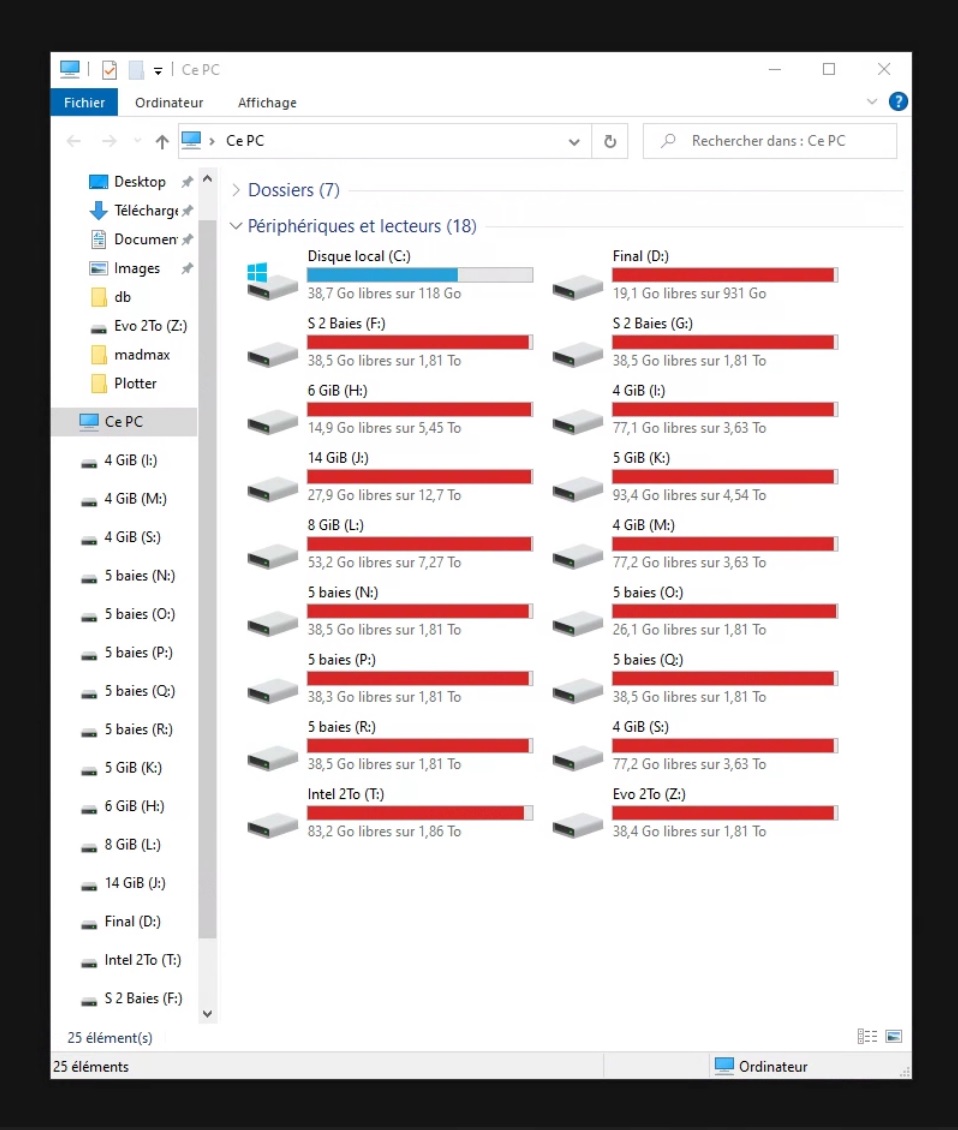
To be fair I don’t want to fill my 124 TB with personal plots, I’d rather fill them with poolable plots. Am eagerly awaiting pooling coming to mainnet.
Sorry if this is a bad piggyback to the thread. But, since I’m plotting with madmax, I thought it might be worth putting in here.
Setup: Ryzen 2700x, 128GB ram, 1TB skynix nvme
OS: Linux Mint 20.x; ramdisk 111GB, os on ssd
For some odd reason, my linux setup (3900 to 4900 seconds) is plotting way slower than my Windows setup (2900 to 3100) with the same hardware. The only thing I haven’t done is to format the nvme drive from ntfs to exfat. But, I find it hard to believe that this would account for a 1000+ second difference in plotting. Every one of the phases within each stage, I’ve noticed that Linux is a few seconds to 100s of seconds slower.
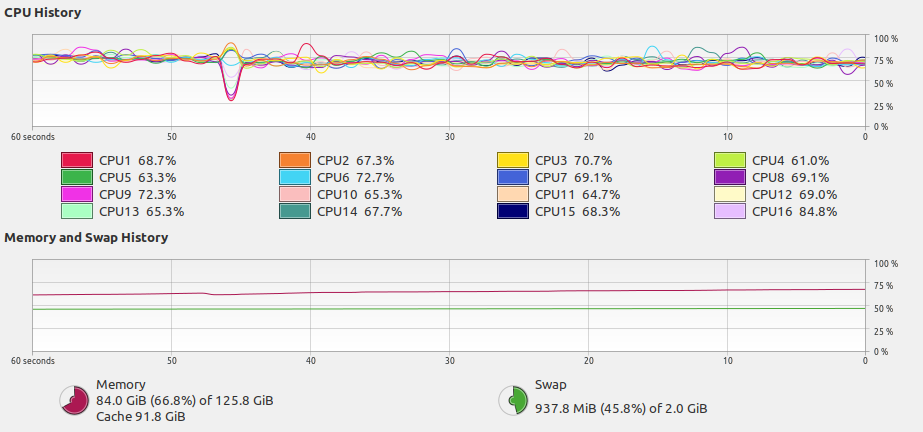
The only thing I can possibly think of is that when it’s plotting, at nowhere in any of the stages, have I seen the CPU usage at 100%. It’a always been at 80% max, no matter if I use 8 or 16 threads (or even 24 just for the hell of it).