Old Intel Xeon servers for plotting: how old is too old?

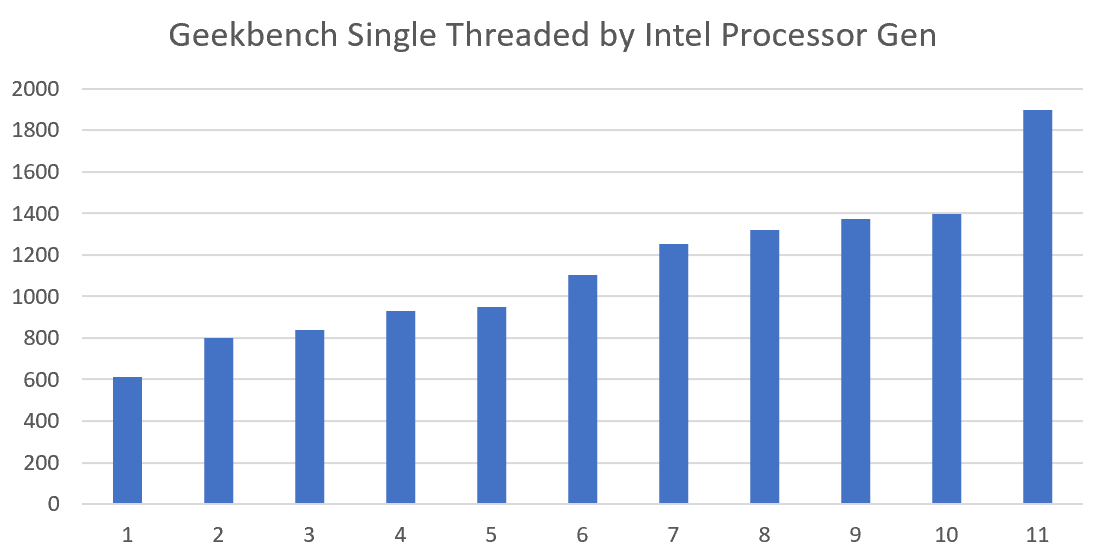
OK, so let’s say you want to build plotting rigs for cheap. You’d go to salvage places and buy 4+ year old decommissioned Intel hardware (all decent AMD stuff based on Zen is too new, so that’s out) with lots of cores! Here are the Intel hardware generations by intro date:

  1. Nehalem (2010, 45nm)
  2. Sandy Bridge (2011, 32nm)
  3. Ivy Bridge (2012, 22nm)
  4. Haswell (2013, 22nm, power consumption improvements)
  5. Broadwell (2015, 14nm)
  6. Skylake (late 2015, 14nm, arch change!)
  7. Kaby Lake (2016, refresh)
  8. Kaby Lake R (2017, refresh)
  9. Coffee Lake (late 2017, introduces core i9, 8+ cores)
  10. Cannon/Ice/Comet Lake (2018, 10nm)
  11. Tiger/Rocket Lake (2020, 10nm, backported arch, L4 cache)

I posted a bunch of 1.0.4 plot time numbers from all the machines I have access to and I can tell you that anything 6th gen Skylake or later, due to the big architecture change, is likely to be “good enough” at building Chia plots.

A very good number – at least of all the machines I have access to – is the i9-9900ks which does 16000s (4.5h) plots. Also the Surface Pro 7, which is a 10th gen Core i7, does 23000s (6.4h) plots, and the NUC i7-10710U does 25000s (7h) plots.

But how much slower is, say, 1st gen Nehalem, or 2nd gen Sandy Bridge? In a different topic @login-taken said a 5th gen Broadwell was doing 62437s (17h) per plot! But then someone else on reddit posted a 3rd gen Sandy Bridge doing 30000s (8.3h) per plot, which is fine…?

Where should a Chia plotter looking for salvage Intel Xeon servers with a lot of cores, spend their $? Which Intel generation? How old is too old? :thinking:

6 Likes

OK, I’m gonna take a crack at this, because I have a very strongly held theory that all that matters for plotting is… single threaded performance. Yes, you can run more plots with more cores, but total plot speed is determined mostly by single threaded performance.

So digging through geekbench results… going for the top of the line in each era based on the Wikipedia page for that architecture, and then looking up that model in the Geekbench single threaded processor results page:

Gen Year Title Model Geekbench ST
1 2010 Nehalem Core i7 Extreme 975 612
2 2011 Sandy Bridge Core i7 Extreme 3970x 800
3 2012 Ivy Bridge Core i7 Extreme 4960X 838
4 2013 Haswell Core i7 Extreme 5960x 928
5 2014 Broadwell Core i7 6950x 951
6 2015 Skylake Core i7 7980XE 1102
7 2016 Kaby Lake Core i7 7740x 1255
8 2017 Kaby Lake R Core i7 8086k 1322
9 2018 Coffee Lake Core i9 9900ks 1371
10 2019 Comet Lake Core i9 10900k 1397
11 2021 Rocket Lake Core i9 11900k ~1900?

On the last one, I had to look it up manually, it wasn’t listed in the overview page… must be hot off the press! To compare, the AMD 5950x scores 1699.

Anyway, it looks like a pretty steady climb to me? Broadwell isn’t that far behind Skylake.

2 Likes

One of my machines is a SuperMicro X9DR7-LN4F motherboard with 2x Xeon(R) CPU E5-2620 v2 @ 2.10GHz (Ivy Bridge) and 128GB of RAM plotting to 2x Samsung SSD 850 PRO 256GB in RAID0. It’s not completely idle because it’s my home lab server, but it’s basically idle because I’m the only user. I was running 4x plots to HDDs at the same time (6 plots total) too. Here are my times for the SSDs (2 parallel plots):

chia plots create -k 32 -n 1 -b 6750 -r 4 -u 128 \
  -f "${fpk}" -p "${ppk}" -t "${tmp}" -d "${dst}" \
    1> "${flog}" 2> "${elog}" &
Total time = 35647.899 seconds. CPU (133.050%) Thu Apr 15 12:21:35 2021
Total time = 37323.691 seconds. CPU (132.430%) Fri Apr 16 04:41:22 2021
Total time = 37814.833 seconds. CPU (128.800%) Fri Apr 16 15:25:13 2021
Total time = 37314.965 seconds. CPU (128.680%) Sat Apr 17 02:00:54 2021
Total time = 37424.037 seconds. CPU (130.650%) Sat Apr 17 12:39:28 2021
Total time = 37657.850 seconds. CPU (131.010%) Sat Apr 17 23:22:40 2021
Total time = 36579.381 seconds. CPU (130.450%) Sun Apr 18 09:48:27 2021
Total time = 36088.662 seconds. CPU (130.270%) Sun Apr 18 20:05:43 2021
Total time = 38091.312 seconds. CPU (131.570%) Mon Apr 19 06:57:45 2021
Total time = 37581.025 seconds. CPU (130.230%) Mon Apr 19 17:41:59 2021
Total time = 36306.983 seconds. CPU (129.660%) Tue Apr 20 04:05:49 2021
Total time = 37188.564 seconds. CPU (129.940%) Tue Apr 20 14:47:03 2021
Total time = 33039.198 seconds. CPU (133.200%) Wed Apr 21 06:02:26 2021
Total time = 37595.511 seconds. CPU (127.910%) Wed Apr 21 16:40:36 2021
Total time = 36038.294 seconds. CPU (129.640%) Thu Apr 22 02:53:33 2021
Total time = 36749.832 seconds. CPU (131.730%) Thu Apr 22 13:19:54 2021
Total time = 37135.238 seconds. CPU (130.230%) Thu Apr 22 23:51:36 2021
Total time = 36233.757 seconds. CPU (130.790%) Fri Apr 23 10:04:35 2021
Total time = 35202.317 seconds. CPU (131.270%) Fri Apr 23 20:06:53 2021
Total time = 37149.562 seconds. CPU (129.730%) Sun Apr 25 01:49:34 2021
Total time = 36650.971 seconds. CPU (129.410%) Sun Apr 25 12:14:29 2021
Total time = 38395.255 seconds. CPU (130.700%) Fri Apr 16 09:09:06 2021
Total time = 38520.077 seconds. CPU (131.280%) Fri Apr 16 20:05:22 2021
Total time = 38652.444 seconds. CPU (129.230%) Sat Apr 17 07:04:09 2021
Total time = 37746.034 seconds. CPU (128.400%) Sat Apr 17 17:47:24 2021
Total time = 37777.937 seconds. CPU (129.670%) Sun Apr 18 04:32:51 2021
Total time = 38249.343 seconds. CPU (130.510%) Sun Apr 18 15:26:53 2021
Total time = 37682.211 seconds. CPU (129.760%) Mon Apr 19 02:11:02 2021
Total time = 36998.414 seconds. CPU (130.140%) Mon Apr 19 12:45:31 2021
Total time = 36700.667 seconds. CPU (130.490%) Mon Apr 19 23:15:27 2021
Total time = 35509.081 seconds. CPU (131.910%) Tue Apr 20 09:28:12 2021
Total time = 37849.428 seconds. CPU (128.890%) Tue Apr 20 20:19:51 2021
Total time = 38537.040 seconds. CPU (130.950%) Wed Apr 21 11:10:22 2021
Total time = 37173.677 seconds. CPU (128.900%) Wed Apr 21 21:41:08 2021
Total time = 37688.747 seconds. CPU (130.320%) Thu Apr 22 08:21:44 2021
Total time = 36244.101 seconds. CPU (130.530%) Thu Apr 22 18:38:25 2021
Total time = 36281.108 seconds. CPU (130.000%) Fri Apr 23 05:08:59 2021
Total time = 33347.020 seconds. CPU (131.800%) Fri Apr 23 14:55:34 2021
Total time = 36302.189 seconds. CPU (129.010%) Sat Apr 24 01:17:25 2021
Total time = 34183.063 seconds. CPU (134.050%) Sat Apr 24 14:41:59 2021
Total time = 36345.863 seconds. CPU (129.650%) Sun Apr 25 05:49:51 2021
Total time = 35811.779 seconds. CPU (129.540%) Sun Apr 25 16:37:15 2021

That’s just over 10h per plot. I’ve never done more than 2 plots to an SSD, but I bet a pair of 2TB NVMe disks (via PCIe adapters) would let you do 12 parallel plots with the above settings if you staggered them as 6 + 6 to avoid overlapping phase 1. You could even reduce it to 2 threads to be safe without losing out too much IMO.

Very (very) roughly, I’d say maxing out this machine would let you average 1 plot per hour or a bit less depending on what kind of a difference NVMe would make.

How does that i9-9900k work? Can you max it out and do 8 simultaneous (1 per core) plots on it and keep the times that low? If so, call it 4.8h for 40 plots in 24h (36m per plot) and that sounds really, really good IMO.

Another thing that I think would be interesting to try, and that I’ll never get a chance to, would be using an old server like mine to do 24 parallel plots (12 + 12 staggered) to 24x HDDs with -b 3389 and -r 2. I bet that would come in around 1h per plot too, but without the need for SSDs/NVMe. Getting enough SATA ports would be a hassle and the last 3 plots to each HDD are a pain. Also, failures, restarts, etc. really, really hurt.

2 Likes

Here’s a graph of Cinebench R10 single threaded which covers quite a few processor generations via AnandTech:

image

This goes up to Skylake (6th gen), you can identify the gen via the model number like so:

11700k 11th gen 13020
10700k 10th gen 10534
9700k 9th gen 10035
8700k 8th gen 9601
7700k 7th gen 9527
6700k 6th gen 8823
5775c 5th gen 7764
4770k 4th gen 7578
3770k 3rd gen 7017
2600k 2nd gen 6397
i7 880 1st gen 4852

I looked up “Cinebench R10 ST” on CPU 2021 Benchmarks - Compare Products on AnandTech and I’ve added those to the above as well, I favored those results over the ones in the graph since that is a central source :point_up_2:

4 Likes

11th gen is the biggest jump in a long time.

1 Like

Yeah also very expensive and hard to find tho. 11th gen is the first architecture change since Skylake (6th gen), so it makes sense. Skylake was a huge bump on many workloads, such as JavaScript and Ruby.

2 Likes

hello
let me know can I use second cpu in chia program on hp server dl380 g9 for ploting?
also i want to know how much time this config needs to make each plot?

hp server dl380 g9
cpu 2650 v3 ×2
ram 32 ddr4 2400
hp ssd 480gb ×2
hdd 12tb ×3

i would really appreciate if you can help me whit upgrate this config for faster ploting.
thanks.
best regards.

See How Many Plots Can I Make a Day? – The Chia Farmer

1 Like

Im getting 2 x Xeon E5-2680 v4 Broadwell (28 core, 56 threads) 1x 2tb Samsung PM883 Enterprise Sata SSD with 32gb ram … Any rough idea how many plots i can do in 24hrs …

1 Like

If that is a regular SATA then you are completely bottle-necked by that SSD, followed by memory. To get any decent speed you need faster transfers speeds, preferably NVME or Data centre PCIe accelerators.

I have 2xE5-2670v1 which are pretty maxxed out doing 10-11 EACH to 2x HP ioDrive II (2.4TB) - around 35-40 a day total - 2 daily rounds of 10 plots, taking 11-12 hours per plot x 2 SSD - and edging upwards as plot distribution/SSD disk space allows

If you are using SATA SSD then you need more than 1 (matching) in RAID 0 to get very far

1 Like

I read this blog and it was very useful and informative. Thank you.
I just have a question does speed of cpu xeon 2650 l v3 ×2 (12 core 1.8 GHz) is suitable for plotting?
let me know your system config and how much time does it take to make each plot?
thanks.

The Dual CPU you quoted used with an ideal combination of SSD and sufficient memory is capable of 10-12 plots for EACH CPU in parallel - each taking 11-12 hours (so 20+ a day each - 40+ in total). If you use SATA SSD then that WILL be far worse (unless you have about 10 in parallel) - Your CPU is capable of about 20-25% more than mine quoted above so 40+ a day with the right SSD combo (more than 1 for sure)

SEVERAL decent NVME in RAID 0 is the bare minimum for that throughput - or a couple of DECENT Data Centre high IOPS SSD running on a PCIE slots (mine are 2.4TB each and are available used for about £330 off ebay - HP ioDrive II-2.4TB ) - look for threads with recommended SSD

The problem with the cheapest NVME SSD is that they cannot SUSTAIN writes for long - once they fill cache they degrade to SATA performance level - better quality and/or data centre SSD can usually sustain high access levels for a lot longer, even if the peak rate seems lower (My Data Centre SSD is half the PEAK speed of my NVME cheap SSD but under load it can sustain 3 times more plot output because it is built to do that)

For throughput in excess of 40+ per day you should be running AT LEAST 64Gb RAM

So it is a complicated mix of CPU, SSD, memory and TUNING

2 Likes

For ease of TUNING i cannot recommend Plotman enough - if you tried to do this yourself you would struggle (I have and am a developer but have moved to Plotman)

It is SUPPOSED to be cross platform but i have only run it (so far) on Linux and it really does support the common tuning/optimization techniques out of the box

1 Like

This is the output from my Plotman on my 2xE5-2670v1 (Dell Precision T5600), 128GB RAM, 2xHP ioDrive 2.4TB, 2x512GB SSD (cheap), 2x2TB HDD

type     drive       used     total    percent   plots
========================================================================
temp   /mnt/md0   1.48TiB   2.16TiB   72.4%     10 (HP ioDrive II 2.4TB)
temp   /mnt/md1   1.56TiB   2.16TiB   76.2%     10 (HP ioDrive II 2.4TB)
temp   /mnt/d1    0.37TiB   0.89TiB   43.6%     2  (single SLOW 1TB SSD)
dest   /mnt/x     1.46TiB   3.56TiB   42.2%     ?  (2x 2TB DATA HDD)
========================================================================

CPU Usage: 74.0% (basically almost flat out) 
RAM Usage: 42.35/125.86GiB(34.5%)  (loads of room to spare)

I am currently edging up my parallel plotting with Plotman (only been using for 24h) but have to watch that CPU usage in early phases - i am considering moving the 2xioDrive II SSD onto a Ryzen 9 3900X/48GB but that involves me taking it down and its more complicated when staggering plotting as i would lose part of a days work - The 3900X has a passmark that is at least 50% more than the Dual E5-2670 but has less RAM - 48GB would max it out lower throughput (but faster per plot) than the old Xeons

I could spend more money to upgrade the 3900X to 64GB … but not until i get a block reward (see the “Unluckiest farmer” thread lol)

The HP ioDrive II completes a plot in about 11-12 hours (10 in parallel) but the SATA 1TB takes AT LEAST 24h and that is with only 2-4 in parallel - i am considering moving the SLOW SATA SSD to another plotter as it feels like it is “wasting CPU”

I am CPU bound on this plotter, and not far from being SSD bound

2 Likes

i9 9900k won’t do 8 plots simultaneously and still complete all phase in 4.5 hours. More like 10 hours to complete. The process slows down when too many plots are open at the same time. I have 5 i9 machines running … overclocked at 5ghz. I’m trying to run 2 plots in phase 1 with 8 threads each. after phase 1 completes in both I start 2 more, etc etc

2 Likes

Hi Folks,

Potentially getting my hands on either of these old servers with the following specs:

DELL POWEREDGE R710:,
176GB RAM,
2* SIX CORES XEON E5645 2.4GHz,
2*600GB 10K SAS

OR

HP PROLIANT DL380P G8 -
2 x XEON E5-2620 -
64GB DDR3 RAM -
4 x 300GB SAS - 2U SERVER

Now I would have to add a 2/4TB NVME for speed (what would I need to do this?)

What could I get per day on this? Is either worth buying @ ~$700

Note that Intel has confirmed advantage; I’ve seen several benchmarks and credible explanations:

1 Like

I am using Skylake-X, ex MacPRO W2140B CPU, and getting 6 hr plots from them, when plotting 3 in parallel. Pretty happy with it.

Both those are too slow for too many parallel plot - the Proliant DL380P has most headroom when upgraded

I am plotting with a Dell Precision T5600 2xE5-2670 - nearly 2xFASTER than either of those too and it is COMPLETELY maxxed out on 2x10 parallel plots making about 25-30 a day on 2xioFusion 2.4TB - i could get more on faster processors

With 4TB NVME you have about 16 parallel plot cap, assuming it is fast enough to sustain that load - best to get 2 decent 2TB in RAID 0 if your MB can support it - Something with decent TBW (say the Sabrent Rocket) will exceed its warranty in about a month but will possibly run on for several months before failing - no promises though

64GB is sufficient for 20 plots - mine hums around 45-50GB on 20 parallel plots (Linux)

You will be CPU constrained on either machine far beyond 10 parallel plot

The R710 can probably be upgraded with the X5670/X5675 - not worth higher as it is diminishing returns
The DL380P has more headroom as the E5-2670v2 can be found around $60-70 each which will increase its thoughput by 2.5 - making it 30/day capable with the right NVME/PCI SSD

The DL380P most economical upgrade is the E5-2670 then it has headroom for 20-25 plots per day

Both seem expensive - i got 3xDL380P for about $120 each - (the ILO was not working which is fine for me) with E5-2640v2 - about 50% faster that yours

If your DL380P can take 8x2.5" 10K SAS than you might able to get 12/day on basic HDD without destroying SSD. however i do recognise it is a race plotting against netspace growth

Lastly, if you don’t want to upgrade the CPU you can’t go far wrong with 2x1TB Sabrent Rocket (NOT Q) in Raid 0 running maybe 15-20 a day (8 in parallel MAX)

Also look at this review - in particular SUSTAINED writes

and this CPU comparison

I used SELL old DL380 with Dual X5670 with 24GB RAM for around $120 ($150 with 64GB) - you are paying for the RAM - and a lot

The DL380P goes for more - but not $700 more

Look up some old Dell Precision T5600 or (preferably) T5610 with 64GB RAM and decent CPU on ebay - you can drop in 2xNVME, and HBA for external drives and run it headless for devastating value - no more than the $700 you are looking at - rackmount servers SHOULD costs a lot less

2 Likes

I’m surprised the 5950x beat the 5800x single core as the latter is lauded as better than the former for gaming. Maybe thermals?