Since I, along with quite a few others, think the 5950x and 16c/32t in general are kind of a “sweet spot” for Chia plotting, here’s a topic for 5950x owners and other people with 16 core / 32 thread CPUs to see what’s optimal.
8 Likes
When I was doing “only” 9 parallel plots on my 5950x here’s what I got:
I do 9 staggered 4c/6gb plots on my 5950x system with 64gb RAM. I should up the memory a little more, I didn’t post times for it so here goes:
Ryzen 5950X / X570 16c/32t, 9 parallel plots, 4c/6gb
plot 1/9
- Total time =
26235.440seconds. CPU (133.800%) Mon Apr 19 00:15:55 2021 - Total time =
25311.904seconds. CPU (134.070%) Mon Apr 19 07:29:56 2021 - Total time =
27298.254seconds. CPU (133.380%) Mon Apr 19 15:18:03 2021 - Total time =
26961.730seconds. CPU (133.060%) Sun Apr 18 16:47:25 2021
plot 2/9
- Total time =
27156.522seconds. CPU (132.680%) Sun Apr 18 17:17:28 2021 - Total time =
25777.321seconds. CPU (134.060%) Mon Apr 19 00:38:44 2021 - Total time =
25110.607seconds. CPU (134.370%) Mon Apr 19 07:45:11 2021 - Total time =
27209.414seconds. CPU (133.240%) Mon Apr 19 15:26:49 2021
plot 3/9
- Total time =
27316.069seconds. CPU (132.560%) Sun Apr 18 17:44:33 2021 - Total time =
25832.624seconds. CPU (134.910%) Mon Apr 19 01:06:47 2021 - Total time =
25309.082seconds. CPU (134.570%) Mon Apr 19 08:21:00 2021 - Total time =
27020.246seconds. CPU (133.240%) Mon Apr 19 16:04:43 2021
plot 4/9
- Total time =
28002.689seconds. CPU (129.530%) Sun Apr 18 17:53:54 2021 - Total time =
25737.511seconds. CPU (134.330%) Mon Apr 19 01:15:50 2021 - Total time =
25580.768seconds. CPU (134.050%) Mon Apr 19 -08:30:40 2021 - Total time =
27368.038seconds. CPU (132.010%) Mon Apr 19 16:15:45 2021
plot 5/9
- Total time =
27147.972seconds. CPU (129.890%) Sun Apr 18 14:11:40 2021 - Total time =
26867.865seconds. CPU (131.800%) Sun Apr 18 21:50:01 2021 - Total time =
25822.351seconds. CPU (131.280%) Mon Apr 19 05:12:20 2021 - Total time =
27687.093seconds. CPU (128.110%) Mon Apr 19 13:06:38 2021
plot 6/9
- Total time =
25964.157seconds. CPU (128.560%) Sun Apr 18 21:23:45 2021 - Total time =
25622.896seconds. CPU (131.940%) Mon Apr 19 04:38:35 2021 - Total time =
27269.767seconds. CPU (127.520%) Mon Apr 19 12:21:09 2021
plot 7/9
- Total time =
27729.357seconds. CPU (130.480%) Sun Apr 18 18:27:53 2021 - Total time =
25364.418seconds. CPU (133.250%) Mon Apr 19 01:42:34 2021 - Total time =
25869.598seconds. CPU (133.490%) Mon Apr 19 09:06:23 2021 - Total time =
27604.056seconds. CPU (132.370%) Mon Apr 19 17:00:17 2021
plot 8/9
- Total time =
27787.066seconds. CPU (130.760%) Sun Apr 18 18:20:39 2021 - Total time =
25767.090seconds. CPU (133.790%) Mon Apr 19 01:42:41 2021 - Total time =
25605.343seconds. CPU (133.970%) Mon Apr 19 08:59:51 2021 - Total time =
27546.598seconds. CPU (132.560%) Mon Apr 19 16:47:40 2021
plot 9/9
- Total time =
26269.964seconds. CPU (132.280%) Sun Apr 18 22:05:44 2021 - Total time =
23608.046seconds. CPU (130.870%) Mon Apr 19 04:47:04 2021 - Total time =
25770.912seconds. CPU (126.490%) Mon Apr 19 12:04:49 2021
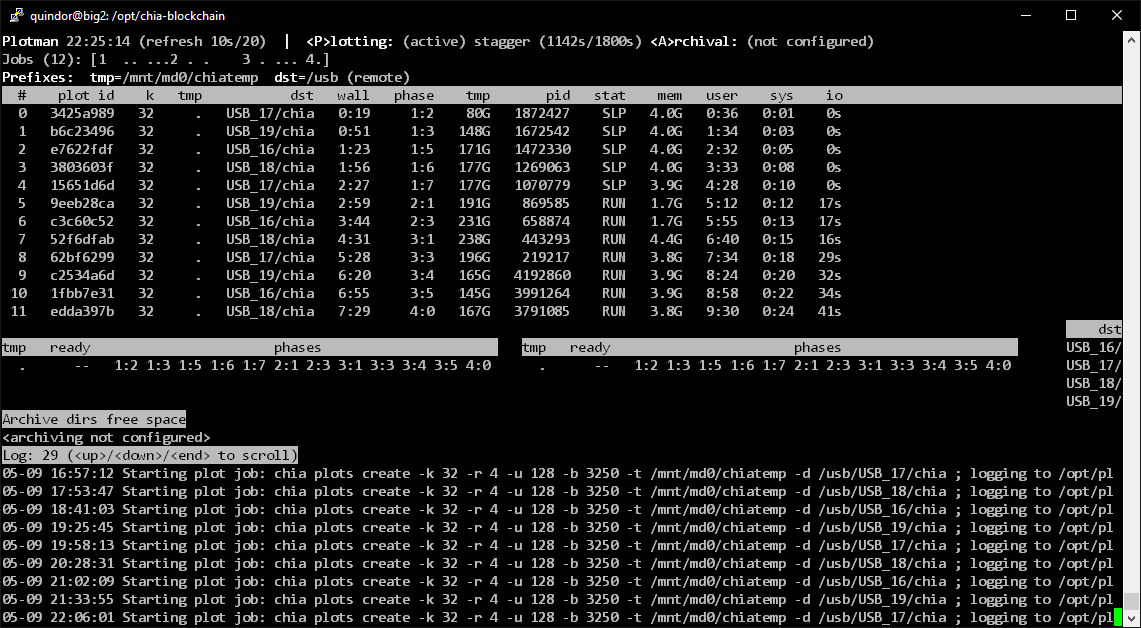
Note that I have six (6) full bandwidth M.2 NVMe 980 Pro 2tb drives as targets (the ASUS Hyper card with bifurcation set) so I never exceed 3 plots per disk. I believe very strongly that disk I/O is not the bottleneck here.
So pretty much 7.5 hours per plot or 27k seconds. That maths out to 28.8 plots per day I guess?
Increasing to 12 parallel plots increased my overall plot time to closer to 30k seconds, but overall it was a gain. Looking at write times in the dump folder (two dump drives), I was seeing 18 per drive or 36 plots per day?
7 Likes
Codinghorror, I’ve been curious what your improvement was like going from 9 to 12 simultaneous plots on the 5950x and what you’ve discovered since then. I saw in the ‘Ordered new Plotter…’ thread that you are skeptical 50/day is achievable. I’ve been closing in on 50/day so I wanted to share my experience and get some other opinions.
To add some data for comparison here:
- AMD 5950x with PBO enabled (~4.6Ghz all core while plotting)
- 4x16gb RAM
- plot parameters: -k 32 -r 4 -u 128 -b 4000
- Running plotman, so a few parameters below are specific to the plotman implementation.
- temp drives: 2x 2TB NVMe on PCIe Gen 3 x4 lanes, 1x 1tb NVMe on PCIe Gen 2 x4 lane (I have an X470 board, so no PCIe gen 4 for me)
- dest drives: local HDDs
- stagger: 30 minutes
- max plots: 14
- max plots per temp: 6 per 2tb NVMe, 3 on the 1tb NVMe
- max plots in phase 1: 5
plotman analyze 2021-05-07*
+-------+----+-------------+--------------+--------------+---------------+--------------+--------------+
| Slice | n  |   %usort    |   phase 1    |   phase 2    |    phase 3    |   phase 4    |  total time  |
+=======+====+=============+==============+==============+===============+==============+==============+
| x     | 46 | μ=100.0 σ=0 | μ=9.7K σ=797 | μ=5.4K σ=679 | μ=10.0K σ=977 | μ=699.2 σ=84 | μ=25.8K σ=2K |
+-------+----+-------------+--------------+--------------+---------------+--------------+--------------+
plotman analyze 2021-05-08*
+-------+----+-------------+---------------+--------------+---------------+--------------+--------------+
| Slice | n  |   %usort    |    phase 1    |   phase 2    |    phase 3    |   phase 4    |  total time  |
+=======+====+=============+===============+==============+===============+==============+==============+
| x     | 47 | μ=100.0 σ=0 | μ=10.0K σ=765 | μ=5.5K σ=725 | μ=10.1K σ=974 | μ=702.4 σ=77 | μ=26.2K σ=2K |
+-------+----+-------------+---------------+--------------+---------------+--------------+--------------+
Interesting observations:
$iostat -h
kB_read    kB_wrtn	Device
  79.0T      72.4T	nvme0n1 (2TB mobo m.2 NVMe Gen 3 x4)
  49.7T      45.4T	nvme1n1 (1TB mobo m.2 NVMe Gen 2 x4)
  74.8T      68.5T	nvme2n1 (2TB no name PCI Gen 3 x4x4 adapter card)
The ratio between my gen3 and gen 2 temp drives is almost exactly 1.6, the relative speed of gen 3 vs gen 2. I suspect this is where gains can be made in my setup.
iowait is typically 1-1.5 hours per plot by end of phase 4. This seems like a lot, and was 2-2.5h prior to adding the 1TB NVMe to the gen 2 slot.
CPU and RAM usage hover around 50% as reported by glances. I have never seen either above 65%. iowait is ongoing, critical, 10% etc.
I have been trying to migrate my 1 TB NVMe to my dual NVMe slot PCI adapter but get io errors after a few hours with the 2nd drive installed.
I wonder if a SSD staging drive would help, at 46 plots per day and 700 seconds per stage 4, I am spending ~9h per day copying plots to HDD.
5 Likes
That’s great!
No question 12 was better; 9 was not enough on the 5950x, assuming you have enough disk I/O.
Thanks for sharing your experiences, but we probably want a 5950x (16c/32t) optimization topic… I might create that and move those posts here? edit: doing it now.
3 Likes
Oh wow, yeah, your temp storage is holding you back big time with those kind of clocks speeds you should be able to get 5 Hour plots easily!
I believe 50 plots per day are possible, even with a 5900x (although I believe 5900x vs 5950x the last will not be much faster unless you give it heaps of cooling to boost as high as a 5900x would in multi-core).
Here is my 3900x box, it’s being kept back because it falls back to mostly 4Ghz for all cores with everything well loaded:
But it is being well utilized, basically almost no IOwait and it’s just the CPU that’s full and can’t do more anymore, which is good, done tuning for this box. ![]()
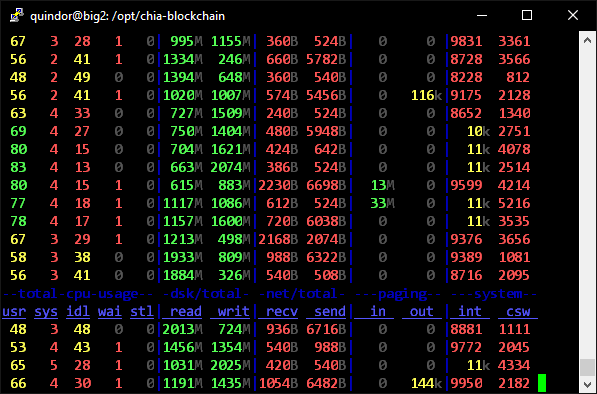
(This is a little tool called “dstat”)
4 Likes
@dougiec if you want to update your experiences with your 5950x here please do! Last you posted 4 days ago, it looked like you were doing 8 parallel plots at around 17000s - 19000s / plot?
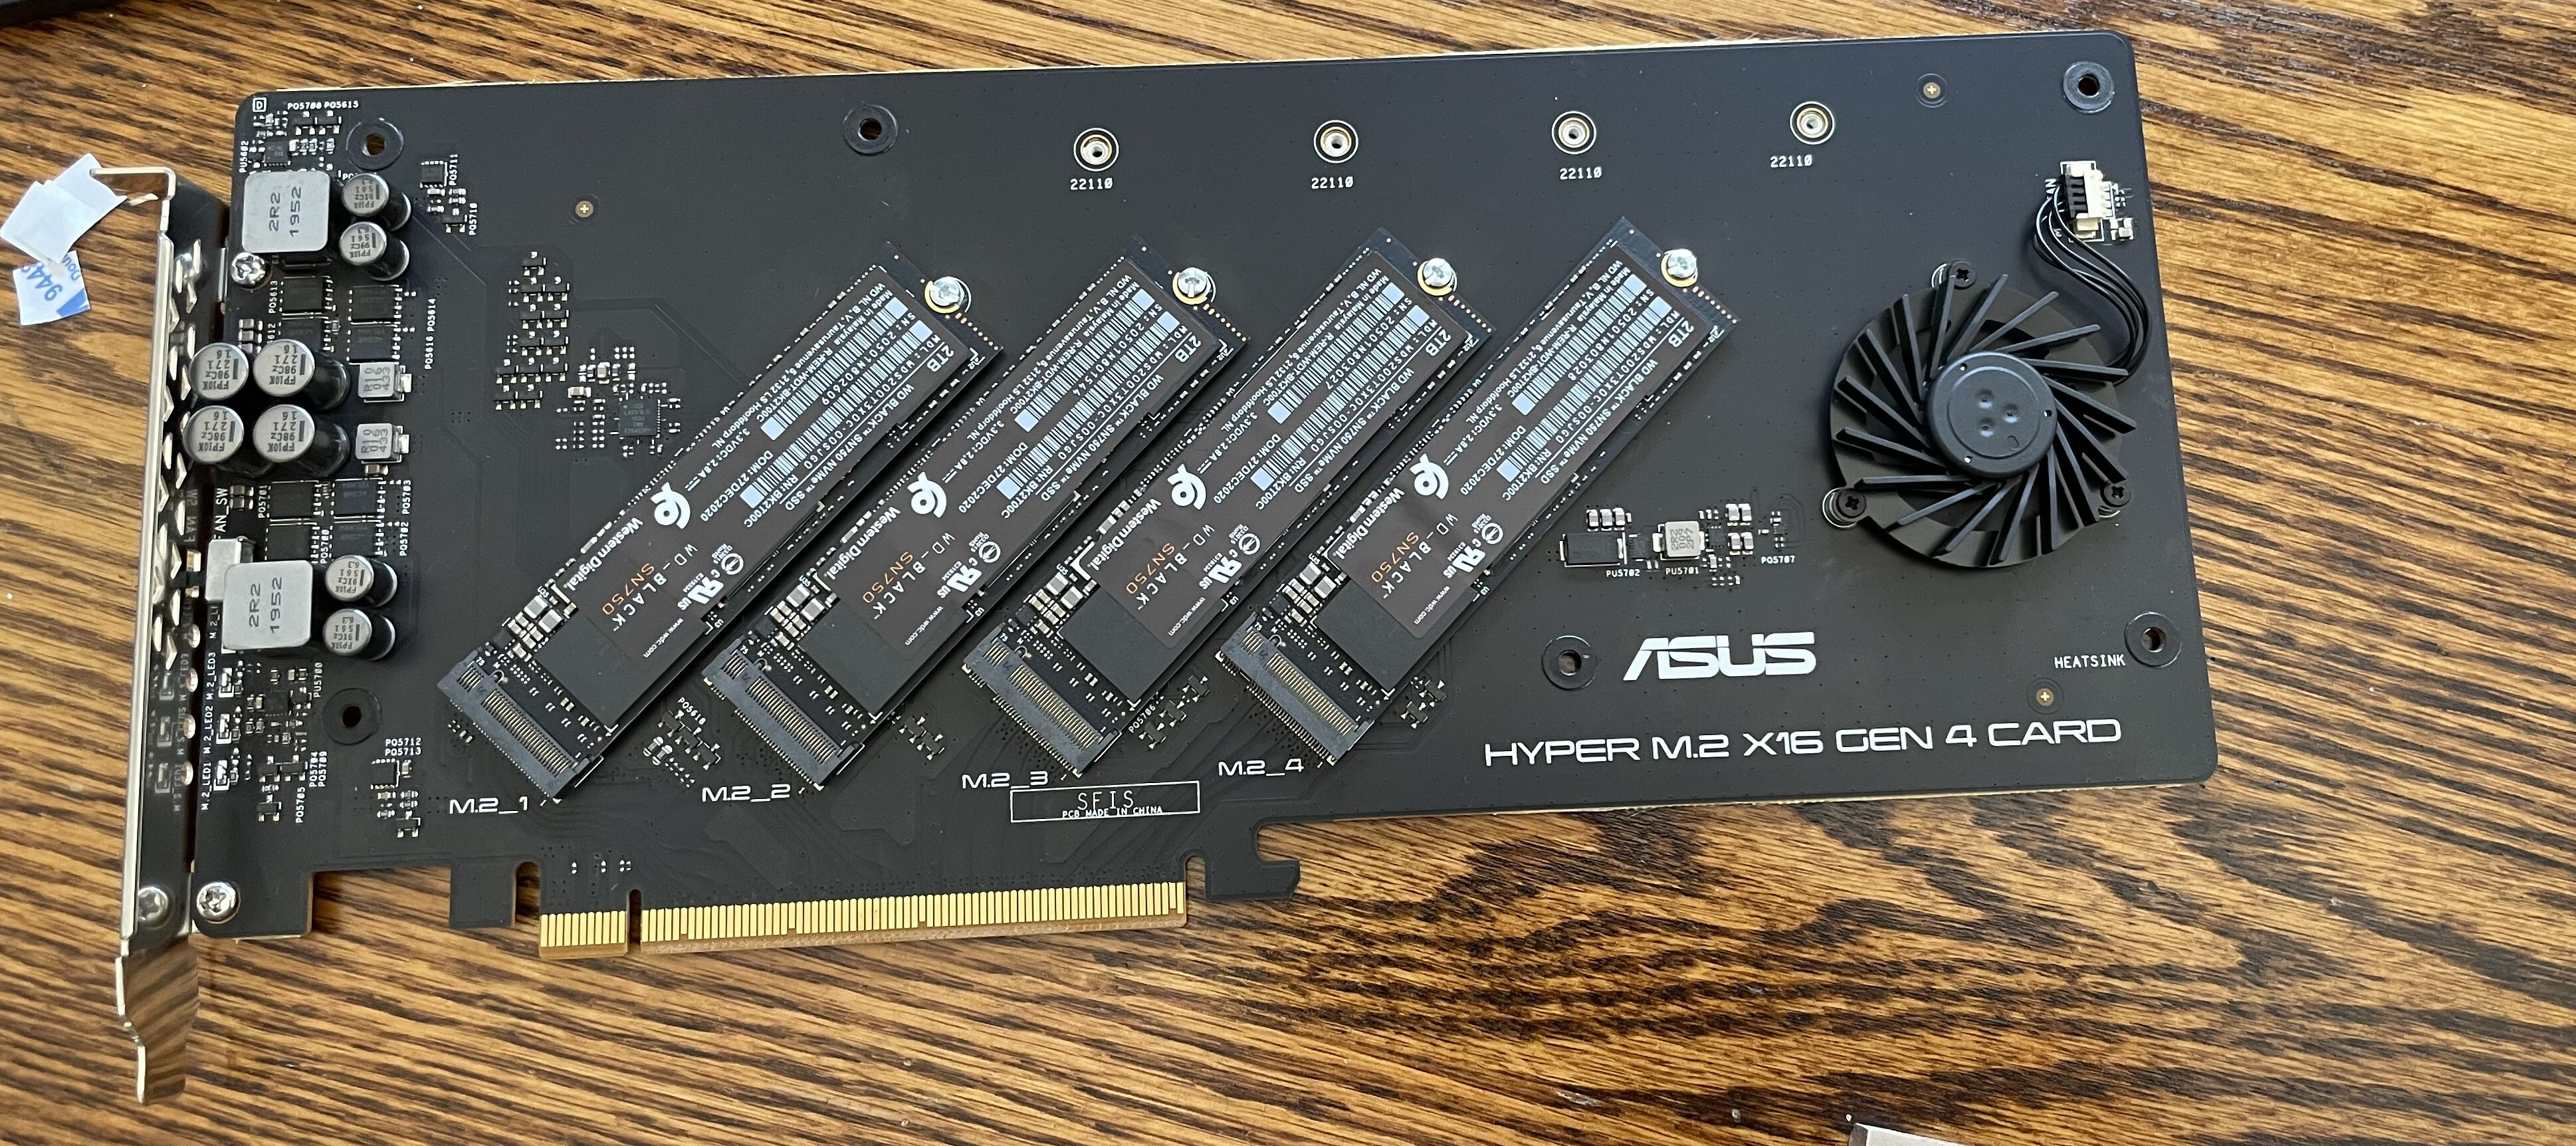
Thanks for sharing! I have the exact same setup lol. So weird. Well Im using 6 SN850 blacks with 4x4 bifurcation on the Asus card. I just got linux installed earlier so will report back some numbers later 
1 Like
I don’t think 50 plots per day is possible on a 5950x; loading all the cores to the absolute max causes core-to-core interactions that slows everything down considerably. And I say that as a guy who has a 5950x with six, count 'em, six full bandwidth 980 pro 2tb NVMe connections… there’s absolutely no way I am overloading I/O in this situation!
I currently do 12 parallel plots and that produces about 36 plots/day. You might be able to goose 4 more out of it but I highly doubt anyone can hit 50 plots/day on any 16c/32t processor.
(Now that I’ve said that, if Intel’s new architecture is really fast, their 16c/32t could perhaps do it? I dunno? Can you even buy an 11th gen Intel 16c/32t chip at this time?)
2 Likes
Oh nice! And how many plots/day are you getting, how many parallel plots are you running? The challenge is 50 per day on any 16c/32t setup, but I honestly don’t think it’s possible…
2 Likes
Challenge accepted. Just got linux installed this afternoon. Bifurcation worked like a charm after enabling in BIOS. Also updated to latest AGESA. Gonna finish up tonight and will let you know the stats. I think 50 is possible
2 Likes
Interesting, on my 5900x I’m already hitting 40+ per day but I’m being kept back by my storage solution on that box, on my 3900x I am not storage limited anymore but CPU.
Are you plotting in Linux? I’d recommend trying Ubuntu 21.04 (newest kernel has better support for 5000 series AMD) and then I’d use aligned partitions on each of the drives and RAID0 4 together using MDADM and then put XFS as the filesystem on it (mount with “discard”!). You should have almost 0 IOwait so should be able to load that CPU until it’s up to about 80% or so, I’d think that would do it (As long as your offload strategy can keep up), as said I’m above 40 plots/day on my 5900x already.
I’m going to win this challenge wth "only " a 5900x 12c/24t! 

5 Likes
holy smokes I am super impressed by your low iowait Quindor… I knew I needed to step up my temp storage but I didn’t realize just how bad it was!
Can you elaborate what you mean by aligned partitions? Setting RAID0 through MDADM resulted in abysmal write speeds for me. I assumed this was due to my janky setup (mixed drives and only 1 native Gen 3 m.2 nvme on the mobo). I didn’t spend any time troubleshooting, and have 0 prior experience with MDADM.
I think 50/day should be very achievable (and likely a bit more), especially with an Asus M.2 X16 Gen 4 Card
PS thanks for consolidating the 5950x topics to this thread codinghorror
2 Likes
Could be a Windows thing, possibly! I’m less into micro-optimizing for a single machine, and more into throwing more machines into the mix… I have 3-4 other Ryzen 5950x machines on the way.
But sharing optimization tips for this config helps everyone, so please do!
(My plotters are definitely waiting as they dump, I have two dump drives, and dump times are like 10 mins.)
1 Like
Well there is several steps to take to make it all perfect but yeah, this box has 4x Corsair Force MP510 1TB in MDADM RAID0 with XFS. I’m preparing videos where I share more of my optimization tips.
5 Likes
I have both the 5950X and 5900X, and my experience is that there is not much of a difference in plotting speed without overclocking. The 5950X crashes my system regularly though while the 5900X does not, would be interested to hear if anybody else is having similar problems with it. I’m already on the latest UEFI and Ubuntu Server 21.04 / kernel 5.11.0, so it should be properly supported like @Quindor already mentioned.
I’m doing 12 plots parallel with 2 threads and 4.6GB memory on plotman, averaging slightly below 7 hours per plot with 30min stagger on two 1.6TB Intel P4610s in RAID 0.
+-------+---+--------+---------+---------+---------+---------+------------+
| Slice | n | %usort | phase 1 | phase 2 | phase 3 | phase 4 | total time |
+=======+===+========+=========+=========+=========+=========+============+
| x     | 1 | 100    | 10.3K   | 5.6K    | 8.2K    | 548.600 | 24.6K      |
+-------+---+--------+---------+---------+---------+---------+------------+
I suppose the 5950X could benefit significantly in the long term from running with more threads, but I haven’t gotten it to stay alive long enough to test that.
2 Likes
I’m surprised by these times actually.
I’m running a 3900x, 64GB RAM on three nvme drives
3 plots per drive, 9 plots total.
With Swar plot manager under windows, i set it to max 3 plots in phase 1
plots running 4t/4600
The plots are running at around 27000 secs, but there is a delay of about 30 minutes sometimes because of the limit on phase 1 plots.
In any case, I would think the 5950X should do a lot better
for SSD’s I have (non-raid)
1 x Gigabyte Aorus 2TB
1 x Transcend 2TB
1 x NS750 1 TB
Can I ask what your procedure is to record times for plotting? Combing through the logs is difficult with the amount of verbose lines. I was thinking about writing a script to parse logs, take time stamps and stages, log in a db, but is there something someone recommends before I reinvent the wheel?
It’s a function in plotman “plotman analyze LOGFILE”
oh fantastic! I really enjoyed your setup overview video, can’t wait to see what tips you share.
FWIW zictes, I’m not experiencing any crashing with my 5950x. My info:
OS: Ubuntu 20.04.2 LTS x86_64
Kernel: 5.8.0-50-generic
Uptime: 3 days, 5 hours, 11 mins
1 Like