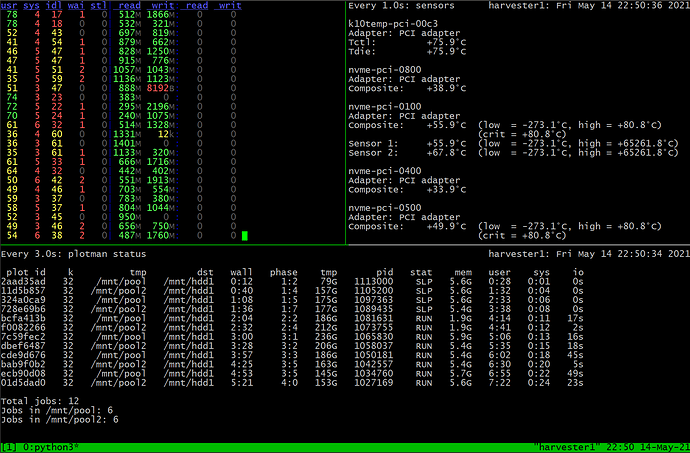
Yeah, so that’s the thing - my targets aren’t all that special:
2x Samsung 970 Pro 1TB M.2 NVMe PCIe 3.0 Gen 3
2x Intel P3600 1.2TB AIC NVMe PCIe 3.0 Gen 3 (7 year old drives, average performance by today’s standards)
These are installed in a B550 motherboard, so 1x 970 Pro and 1x P3600 share just one PCIe 3.0 Gen 3 x4 bus via the chipset. The other 2 each have dedicated x4 lanes to the CPU. I could use my Asus Hyper card so ALL SSDs get their own x4 lanes (or switch to an X570 board), but given my results I don’t feel I need to so that card is going into another machine.
I run Ubuntu Server 21.04 which is supposed to have better support for the latest AMD CPUs, and I connected a video card only to set up the BIOS (enabled XMP for the 64GB Crucial Ballistix 3600MHz RAM) and disabled unwanted things like audio. Then I removed the card and run it headless over SSH.
Each pair of drives are in Btrfs RAID0 with asynchronous TRIM so commands are queued to avoid blocking. I believe XFS discard does this as well, don’t know about Windows.
sudo mkfs.btrfs -f -d raid0 -m raid0 /dev/nvme0n1 /dev/nvme2n1
sudo mount -t btrfs -o ssd,nodatacow,discard=async,space_cache=v2,nobarrier,noatime /dev/nvme0n1 /mnt/pool
I use plotman as below. I settled on 12 parallel plots as the iowait numbers start to rise beyond that (the 1 and 2 in the fourth column of dstat).
directories:
        tmp:
                - /mnt/pool
                - /mnt/pool2
        dst:
                - /mnt/hdd1
scheduling:
        tmpdir_max_jobs: 6
        global_max_jobs: 12
        global_stagger_m: 25
        polling_time_s: 20
plotting:
        k: 32
        e: False
        n_threads: 8
        n_buckets: 128
        job_buffer: 4500
Part way through the day:
+-------+----+-------------+--------------+-------------+-------------+-------------+---------------+
| Slice | n  |   %usort    |   phase 1    |   phase 2   |   phase 3   |   phase 4   |  total time   |
+=======+====+=============+==============+=============+=============+=============+===============+
| x     | 35 | μ=100.0 σ=0 | μ=6.6K σ=106 | μ=5.0K σ=40 | μ=8.3K σ=69 | μ=561.8 σ=9 | μ=20.4K σ=129 |
+-------+----+-------------+--------------+-------------+-------------+-------------+---------------+
Key points
- I don’t know if the RAID0 makes a difference as I set it up like this from day one and don’t want to change it now.
- I’m using older PCIe 3.0 Gen 3 x4 SSDs (2 of which are bandwidth restricted!) so there’s room for improvement here.
- CPU usage averages about 60% and occasionally spikes to 80% so there’s some headroom here, even more with overclocking.
- I use 8 threads for my plots simply because I saw this suggested somewhere. Don’t know if it’s optimal. Usually no more than 4 plots are in phase 1 at one time.
- Higher RAM speeds appear to be beneficial so overclocking this is an option (see 2666mhz vs 3200mhz RAM Plotting Results - #5 by KoalaBlast)
As there is more headroom available, adding more SSDs to bump up the IOPS will probably get it to the 55-60 daily rate, only at this point will the CPU be fully utilized.
