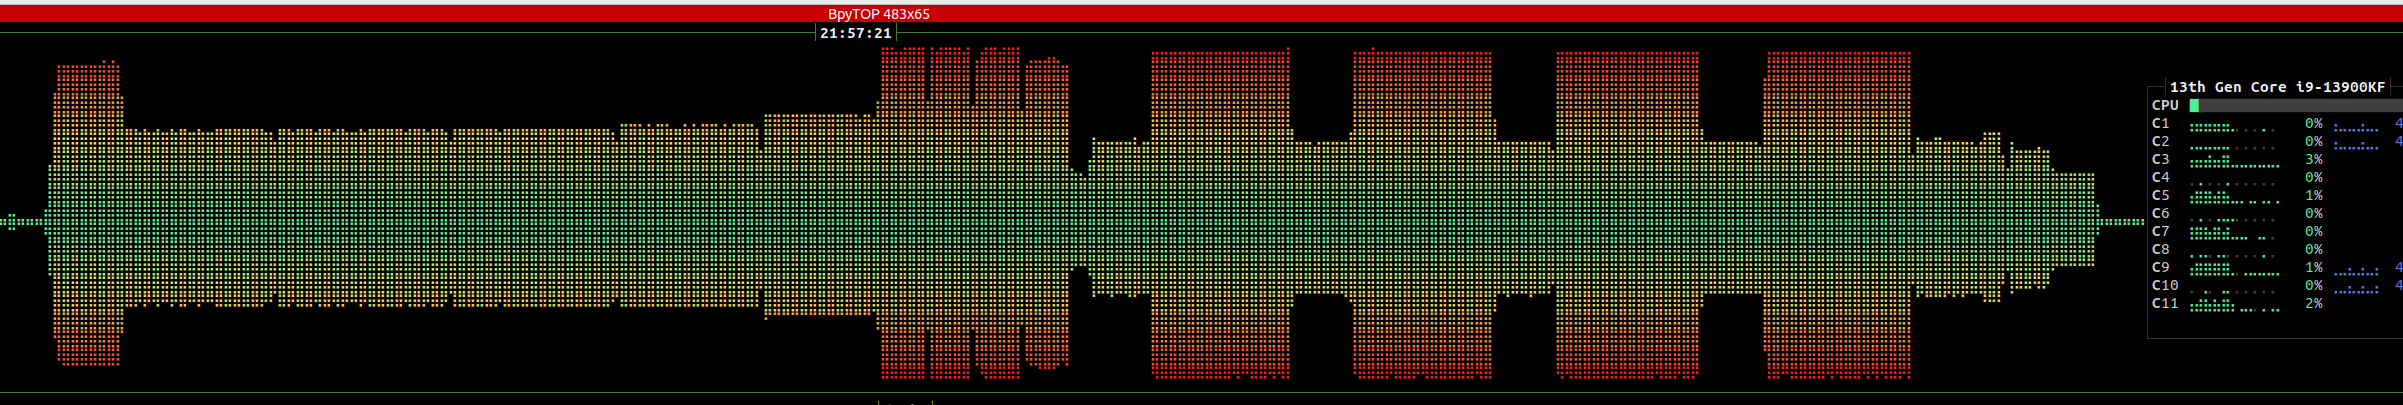
In this pic, the area with no color means algorithm can be even more parallelized, like 5-20% speed up left , if more optimization on plotting software.
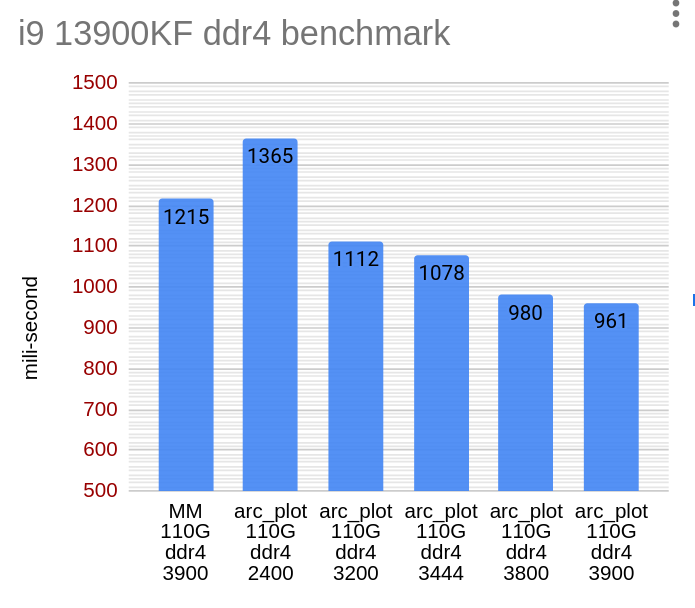
There was another benchmark this week. it’s all about new intel i9 13900kf under different ddr4 ram speed.
I am not sure how to interpret that chart, but aren’t the areas without color (or rather black) where the CPU is waiting for something (maybe RAM, thus faster RAM would benefit those parts, but CPU has still room to go as is, so code optimization will just have more black there), where those that have no black parts are where the CPU is maxing out, thus faster RAM may not provide any benefits, but optimizing that code could provide speed improvements?
This spectrum was created by bpytop ( an linux monitor tools , like top, htop , bpytop ).
The color area is cpu utilized, dark is not. so why cpu is not fully utilized ? two main reason: a.) cpu wait for IO. b.) the algorithm is not parallel well, like there are thread lock,sync,wait in code.
arc_plot achieve 25% higher performance by implemented a new kernel vs old MM, which reduce IO, remove thread waiting etc. so it’s improve performance from software.
If ram speed increase, the performance will increase too if CPU is not the bottle neck.( estimate , 8 cpu core can handle ddr4 two channel, so for main stream pc , ram is away bottleneck. on server side, 16 cpu core will max out quad ram channel etc. )
So here , if i9 13900K need max out it’s raw computing capability, under ddr5 10000+ won’t reach the ceiling floor. ram speed higher = plotting time lower.
For plotting, memory bandwidth > disk io > cpu power. That’s why lots ppl use 8 even 16 memory channel sever. Your old E5 v2 have even higher memory bandwidth vs 13900.
If you once use MM in Ubuntu, that’s all you need to download and run. If you run windows, go through their wiki about WSL to setup. Btw , WSL is kind of virtualization, you ll lost lots of performances
“From above data,by linear regression’s conclusion, 13900+ddr5 6400 , plot time < 10mins?”
In reality, has anyone actually done this for 13 gen platform (or AMD) with DDR5 ? Things are not always as they seem by merely extrapolating. For example, speaking of memory bandwidth, for many platforms, memory bandwidth decreases by 25% to 50% or greater, when jumping from 64Gb to 128GB memory due to the decrease in memory speed required to support more memory channels…at least on consumer hardware.
IOW what makes sense from specs, doesn’t always work out in practice.