Trying to confirm that I'm just unlucky :)

Hi,

I’ve been farming for the past 2 weeks now and I’ve been able to maintain a 0.0035% share of the netspace for a little bit more than 10 days now (often a little bit more, I’m at 0.0037% with 1675 plots at the moment).

I still haven’t won a block though. It’s not completely unexpected, I have a 0.0035% chance of winning each block so roughly a 0.0035*4608 = 16.128% chance of winning each day, or a 83.872% chance of losing every day. The probability of losing for 10 days in a row is then 0.83872^10 = 17.2%. If you add to that the downtime (the harvester crashed for ~4h twice) it’s fair to say that I had 1/5 chance of not winning over 10 days and I’m fine with that, I don’t believe in luck so much but I believe in math and I know that things will normalize over time.

I just want to make sure that I haven’t done any mistake as it would be quite an expansive one…

I’ve spent a LOT of time checking everything multiple times. I’ve also split the harvesting on 2 machines as I was sometime observing some long response time and I wasn’t comfortable with that, here’s the average response time before setting up the second harvester:
image

0.75% of the challenges had a response time >30seconds, it was mostly because of some networking issues. It’s much better now:
image

Now only 4 challenges had a response time >30 seconds (0.08%) and it was mostly because I was setting up things on the bots (mounting disks etc). So I don’t think that the response time is a problem.

If the response time isn’t an issue the problem could be that I’m not attempting all the challenges, I’ve also checked that and I can confirm that there’s ~9200 lines that contain X plots were eligible for farming... emitted to the logs every day. I’m also using Chiamon to parse the logs and store the info about each attempt in a Prometheus data store, this also confirms that roughly 9200 attempts are made each day.

My main farmer is also fully synced, upnp is disabled on my router (Unifi) and port 8444 is properly forwarded. Everything looks good in the GUI:

So my conclusions are:

  • I’m fully synced.
  • The response time is good.
  • I’m attempting each challenge.

So I’m probably just unlucky but I don’t mind too much, I’ll get the expected rewards on the long run. Could someone still sanity check this and let me know if there’s something else I could check?

Thanks!

7 Likes

I’ve also confirmed that the wallet addressed used to generate the plots, the one in the harvester config file and in the farmer config (and everywhere an address is used) is the right one. The Chiamon scraper also tracks the number of proof found and this has stayed at 0.

Set log level to info (you can do this without restarting, edit your config.yaml and it will take effect) and then scan your debug.log.

Anything with WARN or higher is worth a look, and especially harvester eligibility checks.

1 Like

Thanks, I’ve already done that. The logs look pretty good, a lot of this:

2021-05-13T23:51:42.220 full_node full_node_server        : INFO     -> respond_signage_point to peer 220.172.55.114 5013ae954c9bc2c44826efbd8c9fd1b78449025f7d679aa5e67592a0bb3ef547
2021-05-13T23:51:42.419 harvester chia.harvester.harvester: INFO     2 plots were eligible for farming e1d773b4ef... Found 0 proofs. Time: 0.95102 s. Total 413 plots
2021-05-13T23:51:42.420 harvester harvester_server        : INFO     -> farming_info to peer 127.0.0.1 15c731d029cbaffa555cb4681c5c1b7ed04022bd7e81863a0e4976fc0d07
2021-05-13T23:51:42.422 farmer farmer_server              : INFO     <- farming_info from peer 70a635c5bea9ce756864ff288b1195296bbea4461110bb4b6b2d827b 127.0.0.1
2021-05-13T23:51:42.442 full_node full_node_server        : INFO     <- new_signage_point_or_end_of_sub_slot from peer 5013ae954c9bc2c44d8c9fd1b7844902579aa5e67592a0bb3ef547 220.172.55.114

I have some automated tools to process the logs but I also check them manually several time per day to make sure everything is ok.

1 Like

If you’ve set log level to info and scanned for anything unusual I think you’re golden.

I ran into a 5 day dry spell way back when the netspace was a wee tiny 1-2 exabytes, and it was the harvester taking more than 30 seconds to provide proofs due to using multiple NAS’es on the network. At the time, this was not logged as anyhing other than info, which is a bit shocking… that probably cost me 20 XCH, but whaddaya gonna do

1 Like

I think you’re set up properly. You’re getting the correct number of challenges per day (it should be 9216) and you have some plots passing the filter and good response times. Keep an eye out for “1 proof” in your scraper. If you find this and don’t win a reward… that’s bad news.

Good luck!

2 Likes

Awesome! Thanks for your help! I’ll just be patient then :). I’ll keep monitoring the logs of course.

1 Like

FYI: on Linux, this did not seem to be the case, I had to shut down the Chia electron app and re-run it before I got to see debug lines of level INFO start to appear.

2 Likes

1853 plots and still no XCH :slight_smile:

I’ve noticed one suspicious thing in the logs, it’s related to this issue: [BUG] My Raspberry Pi 4 4GB currently misses / doesn't finish plenty of signage points in a row · Issue #1796 · Chia-Network/chia-blockchain · GitHub . There’s often some lines saying something like Signage point XX not added , e.g.:

2021-05-15T17:25:56.942 full_node full_node_server        : INFO     <- new_compact_vdf from peer f21ad0b67605fd7e1e18c7edd673955b191b3200d227d6bf3a05089ca3a23466 66.201.131.133
2021-05-15T17:25:56.944 full_node full_node_server        : INFO     <- respond_signage_point from peer c73c21ceb52e3b82da94cf42bec6643ce41dbb1927973d952e484a8cc554d373 98.221.159.183
2021-05-15T17:25:56.959 full_node chia.full_node.full_node_store: INFO     Don't have rc hash d27e3bf9f22bc16b1449830f15d95ce8f59bf3595013f50044cacbe6e46b565a. caching signage point 6.
2021-05-15T17:25:56.960 full_node chia.full_node.full_node: INFO     Signage point 6 not added, CC challenge: 3b1a6831cf00ee79d193d11736d843bd8cb871d313b2da3eb5e6e7169456a5ab, RC challenge: d27e3bf9f22bc16b1449830f15d95ce8f59bf3595013f50044cacbe6e46b565a
2021-05-15T17:25:56.960 full_node full_node_server        : INFO     <- respond_block from: 173.21.177.194:49608
2021-05-15T17:25:56.971 full_node full_node_server        : INFO     Connection closed: 125.69.44.100, node id: a6b25945884f86603224ef652d9f7e0bcc0c669363cd92207294f8d9673bc63a
2021-05-15T17:25:56.972 full_node chia.full_node.full_node: INFO     peer disconnected {'host': '125.69.44.100', 'port': 8444}
2021-05-15T17:25:57.031 full_node full_node_server        : INFO     <- respond_block from: 123.9.151.24:57896
2021-05-15T17:25:57.043 full_node full_node_server        : INFO     <- request_block from peer afedecffe22ac42defb23128bdd44f4dd1436c625e26e8ff8b59b4fa2cb31059 45.131.32.2
2021-05-15T17:25:57.048 full_node full_node_server        : INFO     <- respond_block from: 222.244.179.96:18111
2021-05-15T17:25:57.056 full_node full_node_server        : INFO     -> respond_block to peer 45.131.32.2 afedecffe22ac42defb23128bdd44f4dd1436c625e26e8ff8b59b4fa2cb31059
2021-05-15T17:25:57.060 full_node full_node_server        : INFO     <- request_block from peer afedecffe22ac42defb23128bdd44f4dd1436c625e26e8ff8b59b4fa2cb31059 45.131.32.2
2021-05-15T17:25:57.067 full_node full_node_server        : INFO     -> respond_block to peer 45.131.32.2 afedecffe22ac42defb23128bdd44f4dd1436c625e26e8ff8b59b4fa2cb31059
2021-05-15T17:25:57.080 full_node full_node_server        : INFO     <- respond_block from: 182.141.130.196:56139
2021-05-15T17:25:57.259 full_node full_node_server        : INFO     <- request_transaction from peer ca711087c222e928ba6b2b6bd257ce14952214758a971646b4b269dc0c92da6c 67.244.7.153
2021-05-15T17:25:57.262 full_node full_node_server        : INFO     -> respond_transaction to peer 67.244.7.153 ca711087c222e928ba6b2b6bd257ce14952214758a971646b4b269dc0c92da6c
2021-05-15T17:25:57.369 full_node full_node_server        : INFO     <- request_block from peer afedecffe22ac42defb23128bdd44f4dd1436c625e26e8ff8b59b4fa2cb31059 45.131.32.2
2021-05-15T17:25:57.372 full_node full_node_server        : INFO     -> respond_block to peer 45.131.32.2 afedecffe22ac42defb23128bdd44f4dd1436c625e26e8ff8b59b4fa2cb31059
2021-05-15T17:25:57.520 full_node full_node_server        : INFO     <- request_block from peer afedecffe22ac42defb23128bdd44f4dd1436c625e26e8ff8b59b4fa2cb31059 45.131.32.2
2021-05-15T17:25:57.521 full_node full_node_server        : INFO     -> respond_block to peer 45.131.32.2 afedecffe22ac42defb23128bdd44f4dd1436c625e26e8ff8b59b4fa2cb31059
2021-05-15T17:25:57.607 full_node full_node_server        : INFO     <- new_transaction from peer 63e1dac5d3b9dea1532ef1b263105605d567a5277f03ec0caedaaa4a1ddf39c1 82.65.171.174
2021-05-15T17:25:57.610 full_node full_node_server        : INFO     -> request_transaction to peer 82.65.171.174 63e1dac5d3b9dea1532ef1b263105605d567a5277f03ec0caedaaa4a1ddf39c1
2021-05-15T17:25:57.676 full_node full_node_server        : INFO     <- request_block from peer afedecffe22ac42defb23128bdd44f4dd1436c625e26e8ff8b59b4fa2cb31059 45.131.32.2
2021-05-15T17:25:57.679 full_node full_node_server        : INFO     -> respond_block to peer 45.131.32.2 afedecffe22ac42defb23128bdd44f4dd1436c625e26e8ff8b59b4fa2cb31059
2021-05-15T17:25:57.749 full_node full_node_server        : INFO     <- respond_transaction from peer 63e1dac5d3b9dea1532ef1b263105605d567a5277f03ec0caedaaa4a1ddf39c1 82.65.171.174
2021-05-15T17:25:57.754 full_node chia.full_node.mempool_manager: INFO     It took 0.003111600875854492 to pre validate transaction
2021-05-15T17:25:57.802 full_node chia.full_node.full_node: INFO     🌱 Updated peak to height 286509, weight 18945738, hh 6e93b8fec2fc0512ceafd2da5539fe4304d48254ab6e27df671c235a4b73f40e, forked at 286508, rh: d27e3bf9f22bc16b1449830f15d95ce8f59bf3595013f50044cacbe6e46b565a, total iters: 925501831640, overflow: False, deficit: 13, difficulty: 356, sub slot iters: 114294784, Generator size: No tx, Generator ref list size: No tx
2021-05-15T17:25:57.988 full_node chia.full_node.full_node: INFO     ⏲️  Finished signage point 6/64: d85d702efabacfaa1829f8b3f3194fcf4b9daf4c3245dad9699e55c38e5d315f 

It’s not clear if it’s really an error but I’d be happy if someone was confirming that they also see this message and also win some blocks sometime :slight_smile:

I’m using Chiadog to monitor my farmer and this morning’s report looks good:
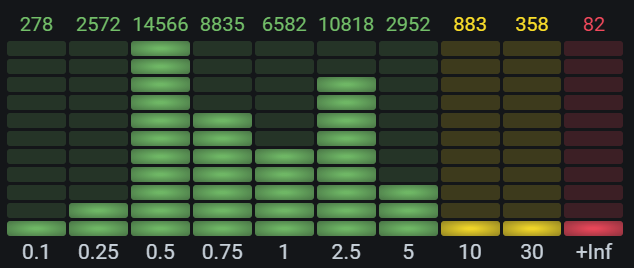
Harvester
Hello farmer!  Here's what happened in the last 24 hours:
Received : 0.00 XCH
Proofs : None
Search : 
     - average: 0.35s over 11396 searches
     - over 5s: 13 occasions (0.1%)
     - over 15s: 11 occasions (0.1%)
Plots : 1361, new: 73
Eligible plots : 2.58 average
Skipped SPs : Unknown (it's just an harvester, not a farmer)
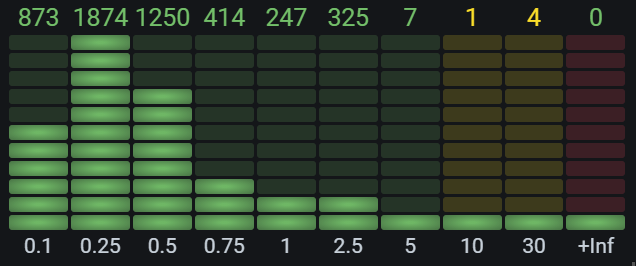
Farmer
Hello farmer!  Here's what happened in the last 24 hours:
Received : 0.00 XCH
Proofs : None
Search 
     - average: 0.52s over 11366 searches
     - over 5s: 113 occasions (1.0%)
     - over 15s: 7 occasions (0.1%)
Plots :seedling:: 451, new: 26
Eligible plots : 0.86 average
Skipped SPs : 72 (0.59%)

11396 searches is above the expected 9200 ones but I’ve changed the reporting time so I think that this report has covered more than 24h.

The 72 skipped SPs happened while I was doing some maintenance on the bot, I don’t miss much anymore (maybe 1 or 2 per hour according to the Chiadog logs).

1 Like

Don’t worry, this is normal.

1 Like

Still no win after ~16 days with a 15% chance of winning (0.0031% netspace share). We’re down to a 7% probability of happening (0.85^16). I’ve double checked my setup many many times and I think that I’m just really unlucky but I’m wondering if there’s something else I could check? I’m attempting all signage points, I always have many plots eligible (4 in average) and my plots are fine (chia plot check only found issues in 2 of them). Anything else I could try? Here’s a snippet from my logs: 2021-05-18T14:52:24.375 full_node full_node_server : INFO -> new_tran - Pastebin.com

So you stopped to miss the signatures by using multiple harvesters?
I am using ChiaDog and I see multiple messages like:

last farming event was 42 seconds ago. this is unusual

or

Siipped 2+ signage points in the last hour

My internet connection seems fine, but I am running 40 disks at the same time on one i5 machine.

I’ve seen a few but it’s usually only ~10 missed SP per day, this should be fine?

Nevermind, I joined HPOOL, I can’t deal with so many bugs at the same time - kernel panicks, connection issues, sync issues…

1 Like

In the same boat, clean across the board :slight_smile:

Well, not winning in a few weeks when your estimated win time is 2 months is ok, you’d have to be really lucky to win. In my case I haven’t won for 17 days when my estimated time to win (based on my netspace share) is ~6 days.

3 Likes

Your analysis is very good, and my theory confirms that the problems of the last updates of the network have been harming from small to large farmers.

The chia team gives no value to the community, and only pushes the problem to keep farmers connected, even without earning anything.

A quick glance at the project’s github, has 18 issues and most are about problems in the latest version related to sync.

2 Likes

Some guys are just unlucky that’s it. Some win with 3 TB after 2 weeks.

I know i will never win with 200 Plots, but at least i can say i tried.

I have a few thousands of plots and no block from more than three weeks.
Look at here:

There is some major issue with a blockchain.
Seems that plotting for now is pointless if you want to farm like developers wants to.

how much it’s cost you to “try” ?