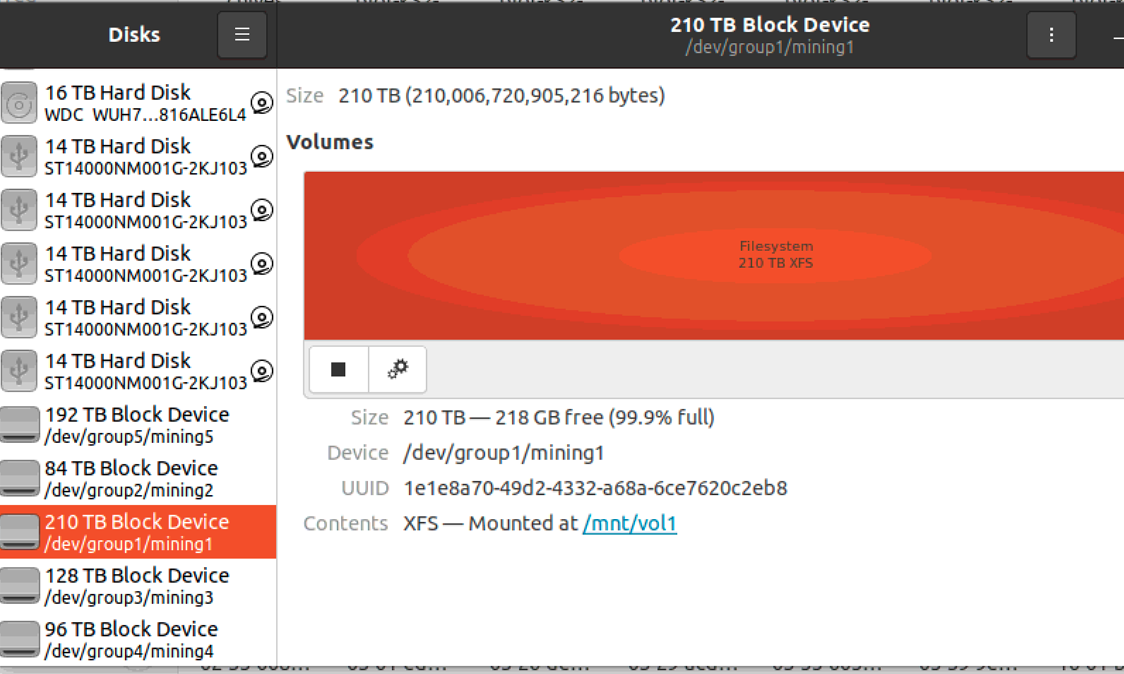
Hi, my chia farmer is under ubuntu 20.04, it’s a supermicro server with 2 xeon processors and 512gb of ram, it has 5 logical volumes of respectively 210TB, 84TB, 128TB, 96TB and 192TB. I have a plot nft linked to 4800 k32 plots. Chia farm summary shows the right number of plots under this plotnft. I moved this nft from self pooling to flexpool but for some reason flexpool sees only 40Tb of plots instead of +500 plots. I thought that maybe there was an issue with the drives going to “sleep” so i changed each drive settings accordingly but it didn’t help. Any idea of what the problem could be?
PS: I forgot to say that sometimes flexpool finds 200TB of plots or even 400Tb for a bit, but then it goes down to 40-50TB or even below 30TB
Sounds like your not responding properly to the pool.
I’d try posting in a flexpool thread, or contacting their support.
When did you switch to Flex, just now? It takes some time (a day?) for any pool to fully recognize the number of your plots. The pool doesn’t see your plots, it only ask you for partials, and based on how your farmer respond, it estimates what you have, i.e., pool never knows exactly what you have.
I’ve switched a while ago so I guess I do have an issue with my partials, would you know by any chance how i could troubleshoot this to hopefully solve this problem? Thanks
Maybe you can first check this video:

He (the author) is really a good guy. He shows there two ways of checking your lookup times (manual - going directly against the debug.log), and automatic (his heat maps code - I use it daily; another good one could be either ChiaDog or farmr).
If you could start with the manual method, and just let us know what you see in the last few respective lines, that would give us some clue.
As far as those stalled ones, here is Flex pool with some random farm:
Right above that “Space” chart on the right side you can see Valid (99.62%), Stale (0.38%), Invalid (0%). Let us know, what percentages you have there.
We have an active chia channel on our discord and support on the website is very helpful
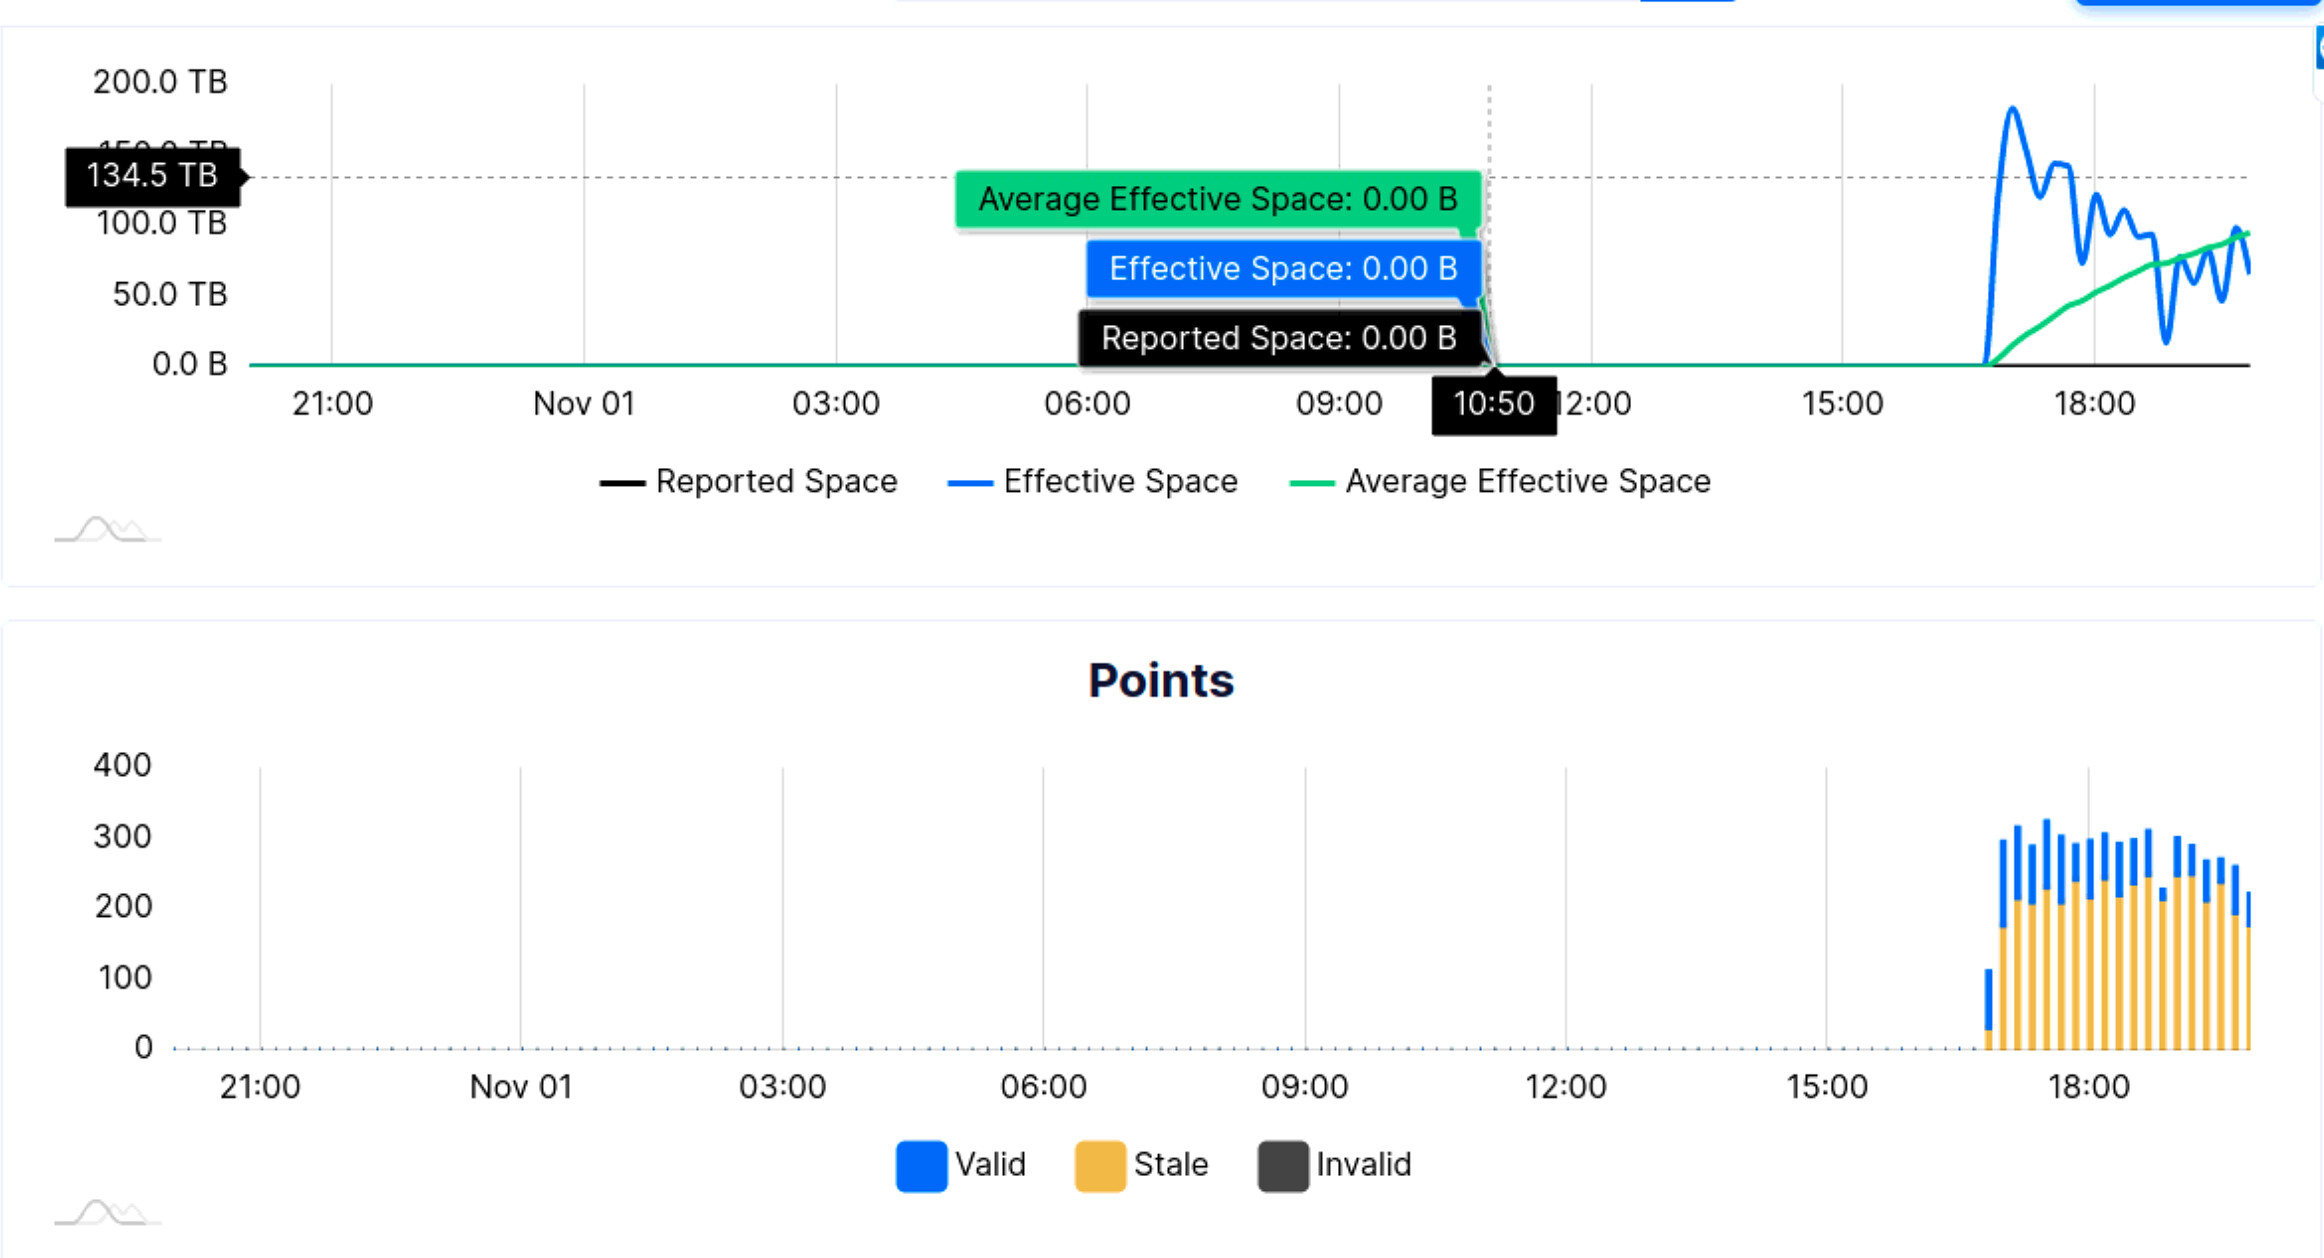
Hi, I have 27.87% valid and 72.13% stale 
Over what period of time?
When you go to your stats page, there are two charts there. Could you take a snapshot of those charts (excluding any identifying data), something like this one:
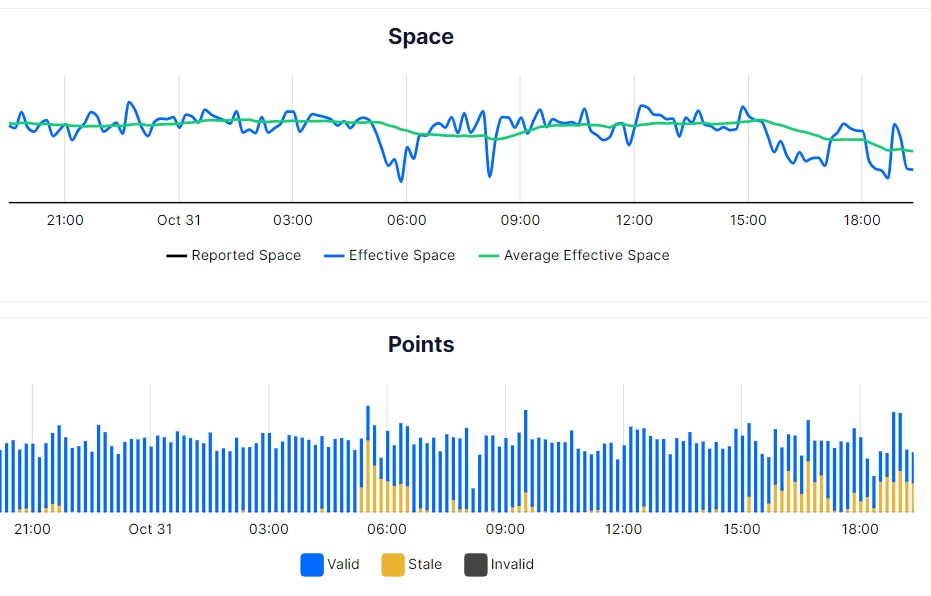
In my case, those yellow parts are stale partials when the attack was at full swing, and my upstream bandwidth was overwhelmed by starving nodes. You can also see how that reflected my farming size / revenue.
Also, what is your upload bandwidth?
Could you also run this command:
tail -n 1000 ~/.chia/mainnet/log/debug.log |grep "plots were eligible"
If you don’t see any output, just increase that number to 10000. Just copy the last 20 lines or so.
2021-11-01T19:50:08.378 harvester chia.harvester.harvester: INFO 16 plots were eligible for farming 20a8e6835c… Found 7 proofs. Time: 3.06235 s. Total 4718 plots
2021-11-01T19:50:17.026 harvester chia.harvester.harvester: INFO 16 plots were eligible for farming 20a8e6835c… Found 10 proofs. Time: 1.05683 s. Total 4718 plots
2021-11-01T19:50:26.256 harvester chia.harvester.harvester: INFO 11 plots were eligible for farming 20a8e6835c… Found 6 proofs. Time: 1.19251 s. Total 4718 plots
2021-11-01T19:50:33.884 harvester chia.harvester.harvester: INFO 9 plots were eligible for farming 20a8e6835c… Found 4 proofs. Time: 1.02844 s. Total 4718 plots
2021-11-01T19:50:41.911 harvester chia.harvester.harvester: INFO 8 plots were eligible for farming 20a8e6835c… Found 4 proofs. Time: 0.87322 s. Total 4718 plots
2021-11-01T19:50:50.471 harvester chia.harvester.harvester: INFO 8 plots were eligible for farming 20a8e6835c… Found 8 proofs. Time: 1.06808 s. Total 4718 plots
2021-11-01T19:50:59.898 harvester chia.harvester.harvester: INFO 15 plots were eligible for farming 20a8e6835c… Found 8 proofs. Time: 1.46841 s. Total 4718 plots
2021-11-01T19:51:08.920 harvester chia.harvester.harvester: INFO 8 plots were eligible for farming 20a8e6835c… Found 4 proofs. Time: 1.22224 s. Total 4718 plots
2021-11-01T19:51:19.166 harvester chia.harvester.harvester: INFO 6 plots were eligible for farming 20a8e6835c… Found 3 proofs. Time: 1.14674 s. Total 4718 plots
2021-11-01T19:51:27.018 harvester chia.harvester.harvester: INFO 7 plots were eligible for farming 20a8e6835c… Found 9 proofs. Time: 1.33217 s. Total 4718 plots
2021-11-01T19:51:36.773 harvester chia.harvester.harvester: INFO 6 plots were eligible for farming 20a8e6835c… Found 6 proofs. Time: 0.89198 s. Total 4718 plots
2021-11-01T19:51:44.451 harvester chia.harvester.harvester: INFO 9 plots were eligible for farming 20a8e6835c… Found 2 proofs. Time: 0.93333 s. Total 4718 plots
2021-11-01T19:51:53.449 harvester chia.harvester.harvester: INFO 11 plots were eligible for farming 20a8e6835c… Found 6 proofs. Time: 0.91538 s. Total 4718 plots
2021-11-01T19:52:03.230 harvester chia.harvester.harvester: INFO 13 plots were eligible for farming 8d50331542… Found 11 proofs. Time: 2.17577 s. Total 4718 plots
2021-11-01T19:52:10.891 harvester chia.harvester.harvester: INFO 2 plots were eligible for farming 8d50331542… Found 2 proofs. Time: 1.07511 s. Total 4718 plots
2021-11-01T19:52:19.420 harvester chia.harvester.harvester: INFO 11 plots were eligible for farming 8d50331542… Found 5 proofs. Time: 0.89621 s. Total 4718 plots
2021-11-01T19:52:27.539 harvester chia.harvester.harvester: INFO 10 plots were eligible for farming 8d50331542… Found 6 proofs. Time: 1.02517 s. Total 4718 plots
2021-11-01T19:52:40.898 harvester chia.harvester.harvester: INFO 16 plots were eligible for farming 8d50331542… Found 8 proofs. Time: 6.36731 s. Total 4718 plots
2021-11-01T19:52:44.087 harvester chia.harvester.harvester: INFO 6 plots were eligible for farming 8d50331542… Found 0 proofs. Time: 0.43721 s. Total 4718 plots
2021-11-01T19:52:52.642 harvester chia.harvester.harvester: INFO 14 plots were eligible for farming 8d50331542… Found 7 proofs. Time: 0.88334 s. Total 4718 plots
2021-11-01T19:53:00.840 harvester chia.harvester.harvester: INFO 13 plots were eligible for farming 8d50331542… Found 6 proofs. Time: 1.33029 s. Total 4718 plots
2021-11-01T19:53:08.660 harvester chia.harvester.harvester: INFO 9 plots were eligible for farming 8d50331542… Found 4 proofs. Time: 0.93844 s. Total 4718 plots
2021-11-01T19:53:18.928 harvester chia.harvester.harvester: INFO 7 plots were eligible for farming 8d50331542… Found 3 proofs. Time: 0.74749 s. Total 4718 plots
2021-11-01T19:53:37.132 harvester chia.harvester.harvester: INFO 4 plots were eligible for farming 8d50331542… Found 1 proofs. Time: 3.05432 s. Total 4718 plots
2021-11-01T19:53:37.134 harvester chia.harvester.harvester: INFO 9 plots were eligible for farming 8d50331542… Found 3 proofs. Time: 10.76091 s. Total 4718 plots
2021-11-01T19:53:44.273 harvester chia.harvester.harvester: INFO 9 plots were eligible for farming 8d50331542… Found 4 proofs. Time: 1.11417 s. Total 4718 plots
2021-11-01T19:53:55.157 harvester chia.harvester.harvester: INFO 5 plots were eligible for farming 8d50331542… Found 3 proofs. Time: 0.80232 s. Total 4718 plots
2021-11-01T19:54:09.751 harvester chia.harvester.harvester: INFO 12 plots were eligible for farming 8d50331542… Found 8 proofs. Time: 6.45733 s. Total 4718 plots
2021-11-01T19:54:11.701 harvester chia.harvester.harvester: INFO 7 plots were eligible for farming 8d50331542… Found 1 proofs. Time: 0.65051 s. Total 4718 plots
2021-11-01T19:54:20.250 harvester chia.harvester.harvester: INFO 6 plots were eligible for farming 8d50331542… Found 1 proofs. Time: 0.77602 s. Total 4718 plots
2021-11-01T19:54:30.072 harvester chia.harvester.harvester: INFO 11 plots were eligible for farming 8d50331542… Found 9 proofs. Time: 1.51130 s. Total 4718 plots
2021-11-01T19:54:37.618 harvester chia.harvester.harvester: INFO 9 plots were eligible for farming 8d50331542… Found 5 proofs. Time: 1.16770 s. Total 4718 plots
1 Like
it shows only stats starting a few hours ago as I tried to do self pooling today as I thought something was wrong with Flexpool
Were you referring to the upload bandwidth of my modem?
What kind of Xeon processors you have. Also, how do you connect to those logical volumes?
The good part is that Flex is seeing your partials, Also your points are in good range.
The bad part is that your lookups are not that good.
As your stale partials are right now overwhelming everything else. I would disable all your volumes but one, and monitor those lookup times for an hour. And do that for each individual volume. Maybe there is something wrong with one of them.
Once you circle through them, I would get two volumes running at the same time, and check your lookup times again, whether those are still in reasonable ranges, and slowly add one more volume each hour (just to get enough data about that behavior).
Also, I am not sure how your volumes are set up, but I would run hdparm to check their speeds. Maybe even start from this one. You can run hdparm while your Chia is working, as those are rather short tests.
Yes, your ISP upload. You can check it with speedtest.net
2 Intel E5-2697 v2 @ 2.70ghz
the whole thing is in a Supermicro 4U server. ok I will start with hdparm now
thanks!
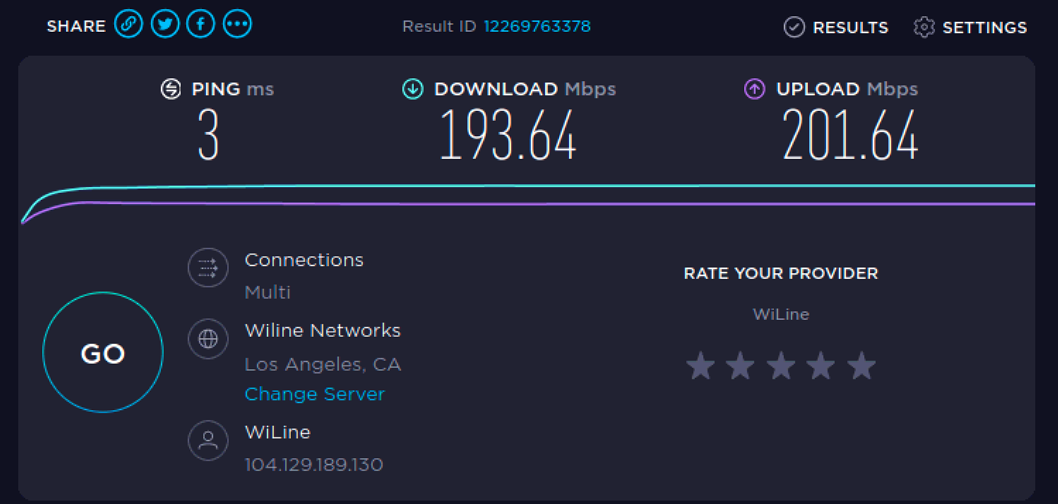
Now you have to know that this is the satellite connection from my office, it shows good numbers on paper but we have some issues with it, I don’t think it’s really stable to be honest
Can hdparm check the whole logical volume or do I have to do it one disk at a time?
I did test a few drives
root@sm2:/home/sm2# hdparm -t /dev/group5/mining5
/dev/group5/mining5:
HDIO_DRIVE_CMD(identify) failed: Inappropriate ioctl for device
Timing buffered disk reads: 732 MB in 3.00 seconds = 243.83 MB/sec
root@sm2:/home/sm2# hdparm -t /dev/sda
/dev/sda:
Timing buffered disk reads: 730 MB in 3.01 seconds = 242.85 MB/sec
root@sm2:/home/sm2# hdparm -t /dev/sdp
/dev/sdp:
Timing buffered disk reads: 784 MB in 3.00 seconds = 260.90 MB/sec
root@sm2:/home/sm2# hdparm -d /dev/sdp
/dev/sdp:
HDIO_GET_DMA failed: Invalid argument
root@sm2:/home/sm2# hdparm -v /dev/sdp
/dev/sdp:
multcount = 0 (off)
readonly = 0 (off)
readahead = 256 (on)
geometry = 1702132/255/63, sectors = 27344764928, start = 0
root@sm2:/home/sm2#
Those are really great space heaters ![]() I also have two of those in my plotter (powered off for now). My box drew about 450W on average when plotting. So, this is good, we don’t need to worry about it.
I also have two of those in my plotter (powered off for now). My box drew about 450W on average when plotting. So, this is good, we don’t need to worry about it.
I really don’t know how satellite ISPs perform, but whatever it is, even if you get down to 5Mbps, you are sill in a good shape.
Although, satellites usually or rather have to have long delays. I am not really sure how you got that 3ms ping. It is superb, but i think doesn’t reflect satellite connection.
So, this is kind of a mixed bag. As you said, seeing those numbers, it is superb, but …
As mentioned, I don’t know how your volume is structured. Is that JBOD, or RAID? hdparms is not aware about volume’s layout, it just blindly asks to read/write. Just run it against your mount point, and let’s see what it will report.
they are logical volumes on Ubuntu 20.04 using LVM2. I’ve been wondering if maybe these volumes are just too big. they are .xfs which is supposed to be the fastes on linux
Those are good timings, so that maybe can also be put to sleep.
I still don’t get your volumes ![]() You mentioned that your first volume is 210TB. LVM is partitioning part, so I am not sure how you get that 210TB, you were just expanding your partition by adding those drives? (that would be either jbod or raid span)
You mentioned that your first volume is 210TB. LVM is partitioning part, so I am not sure how you get that 210TB, you were just expanding your partition by adding those drives? (that would be either jbod or raid span)
Maybe a different question. How big is your /dev/sdp ?
Nah, you don’t need to worry about size or format for harvesting. XFS is good.
I would also start another thread asking if anyone else is on a satellite uplink, and whether that works for them.