My rule of thumb is 57%, based on the famous graph…
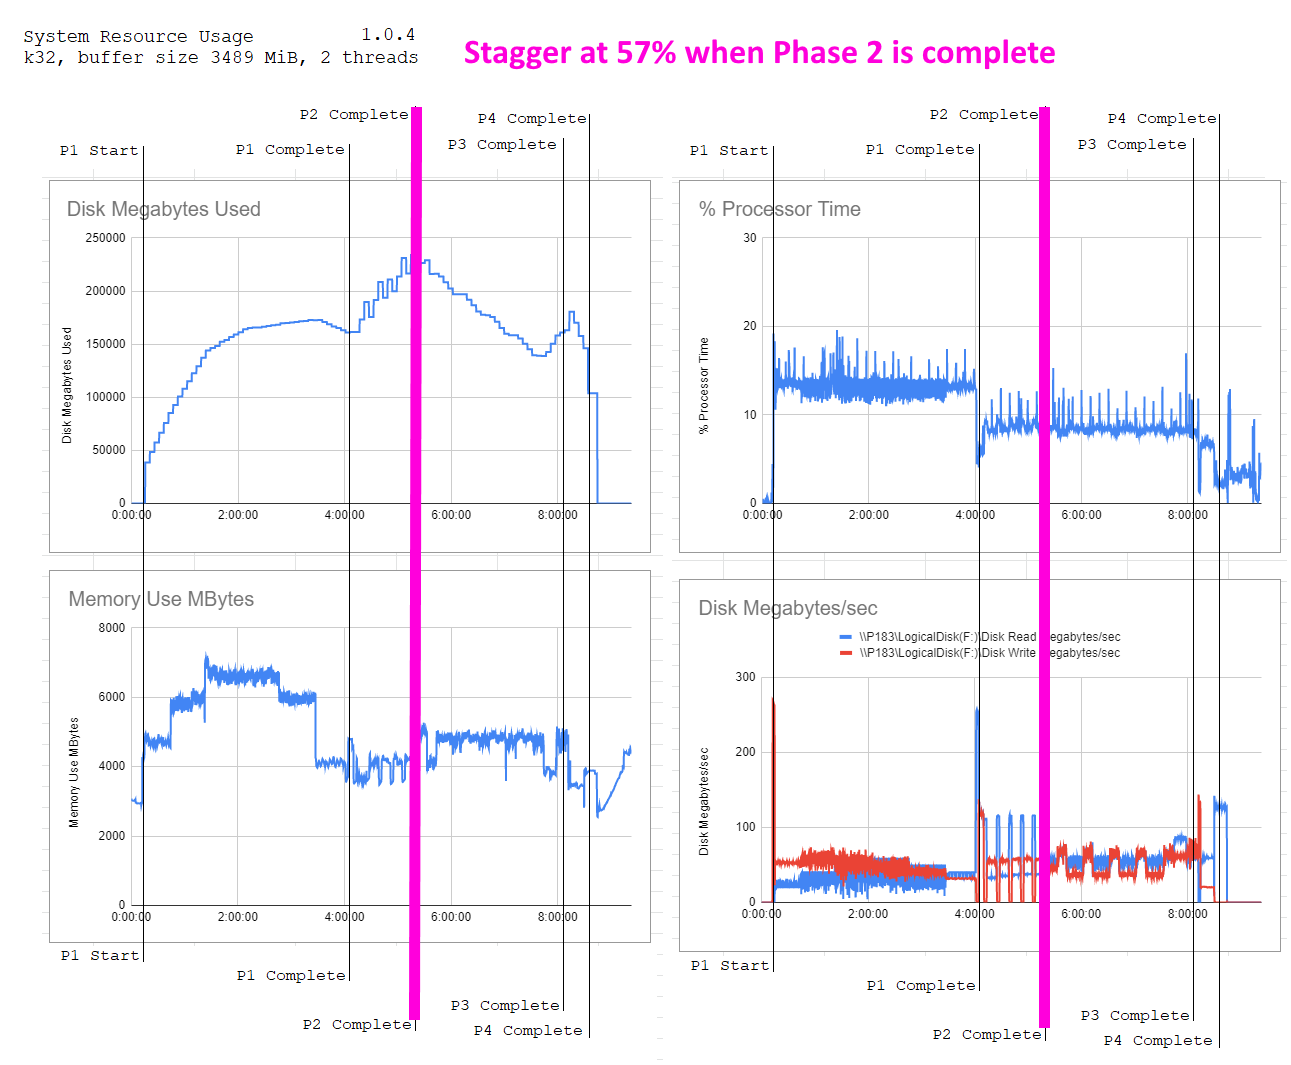
Total width there is 465 pixels, the P2 complete line is at 266 pixels, that is 57%
So figure how how long 57% is for your rig on a single plot, then use that. There is a bit of chaos theory at work here since multiple plots will slow things down, so you might want to stagger with the single plot 57% value, then see what the measured total plot time is with {x} plots going, and increase your stagger to that.
So for example …
-
a single plot might be 500 minutes or 8.3 hours, 8.3h × 0.57 = 4h 45m.
-
you set up 5 parallel plots, and your plot time increases to 10 hours. 10 hours × 0.57 = 5h 42m.
But 57% is, in my opinion, an excellent starting pont.