Still getting my head around the basics so go easy!
Trying to figure out optimum settings/delay for multiple plots so I can just set this up and go away for a few days. Basically I don’t want to come back and find its crashed!
So do you reckon I will be ok, if I set up parallel plotting (2 plots at a time) per SSD/M2 with a delay of 202 mins. 2 threads per plot & leave RAM as default or is there scope to increase threads/RAM allocation?
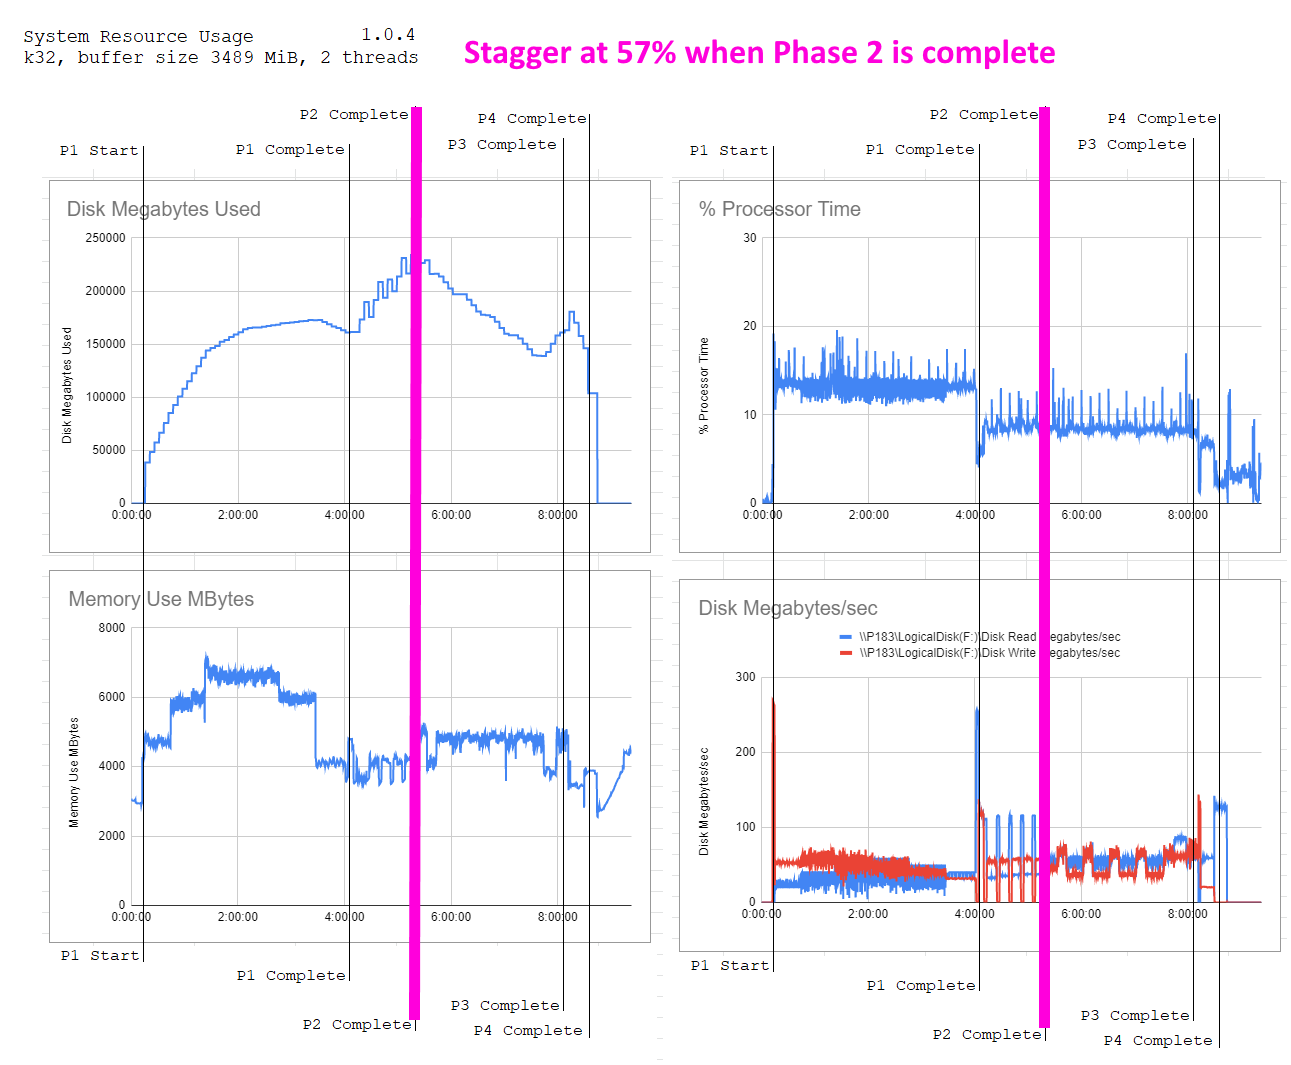
Total width there is 465 pixels, the P2 complete line is at 266 pixels, that is 57%
So figure how how long 57% is for your rig on a single plot, then use that. There is a bit of chaos theory at work here since multiple plots will slow things down, so you might want to stagger with the single plot 57% value, then see what the measured total plot time is with {x} plots going, and increase your stagger to that.
So for example …
a single plot might be 500 minutes or 8.3 hours, 8.3h × 0.57 = 4h 45m.
you set up 5 parallel plots, and your plot time increases to 10 hours. 10 hours × 0.57 = 5h 42m.
But 57% is, in my opinion, an excellent starting pont.
I still trying to solve the early loop effect , addition to what you’ve posted a while ago @codinghorror
For example, 8 parallel plot loop. The first few are done very fast because there is much resource available but the last few are slower.
When the loop is done, the first one is plotted again and now the time spacing is all ruined.
I guess the optimized delay between parallel plotting shall be different for each one instead of the same delay, but I still don’t know how to find.
I believe in CLI you only see start and finish time, with duration.
The graph simply shows how much resources are used up at each phase.
57% of total time . In that graph, the total time is slightly over 8 hrs.
This is not a stone fixed, but depends on your system. It only gives you a ballpark
delay so the file can be offloaded to storage (final copy time)
delay between plots so Phase 1, the only multi-threaded phase has access to the CPU cores it needs.
Hence my suggestion that a good parallel plot delay is 57% of total plot time, above
If final copy time gets slowed down – if you accidentally let two plots try to write to slow storage at the same time – then timings are going to be thrown off.
Yeah I’m a bit confused by that 57% rule myself, because like you say, that would result in running only a few plots, instead of 7.
If you want to run 7, then guestimate the plot time for that. I would guess on your system to about 8 hours per plot. If you divide the total (guess)plot time by the number of plots, you get 68 minutes.
I would go a bit below that to make sure that there is no waiting time after the first plot finishes.
so maybe 60 minutes (45 is what I am using but I’m running 8 at a time with more cores)
60 mins should about work out to having 3 plots in phase one at a time
But you just have to start with an educated guess like this and the adjust based on the actual results.
Also warmly recommend using something like Swar’s plotmanager where you can just set a max number of plots to be in phase 1 at the same time as well as a bunch of other things.
I think the confusion is that when I personally say stagger I mean “delay between starting” not “delay between all plots”.
So you start, say, 4 plots (if you have 16 cores), then the next 4 all start 57% of plot time later, and everything repeats with no delay from that point on. I mean initial delay only, not delay after every plot. I think the community definition is more correct, though… and the plotting tools have evolved to be more sophisticated, so they monitor system resources and start plots at exactly the right time to make best use of the system resources.
I still do not get how the "stagger’ as a concept can work. It seems like an unstable equilibrium. Get it slightly off and either your plotting will grind to a halt to ever increasing number of plots being added to the system if you get the stagger value too low, or it will devolve to a single queued plot if you get it far too low. If you get it a bit too low the results might initially be chaotic, eventually moving to either side
Yes, that’s what the good ones do now from what I’ve read… that’s how the one guy was able to achieve 50 plots/day from a 5950x system. Also requires Linux since Linux has that 128-bit compiler advantage and 10% of 50 is 5!
Not really, at least not with plot manager.
It just won’t start a new plot as long as there is another one running that is below the number you set.
So in my case every new plot that gets started starts a minimum of 45 minutes after the previous one.
Since there is also a max total plots setting, it never exceeds that either.