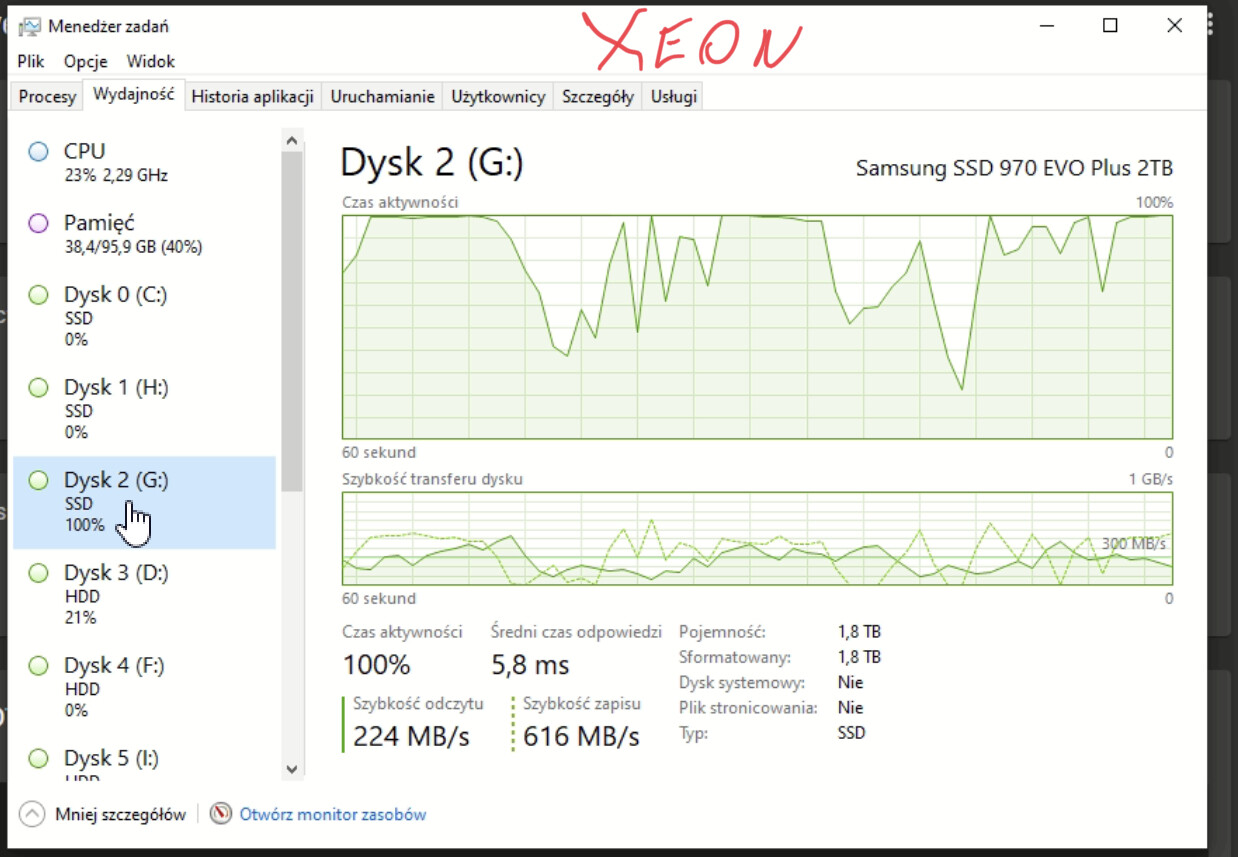
for me it is also strange, the disk speed tests show good speeds, so the nvme adapter probably ok. maybe the problem is the ghz of the cpu, 2.2ghz. I will buy an ASUS adapter and check it, I don’t know how to solve it anymore.
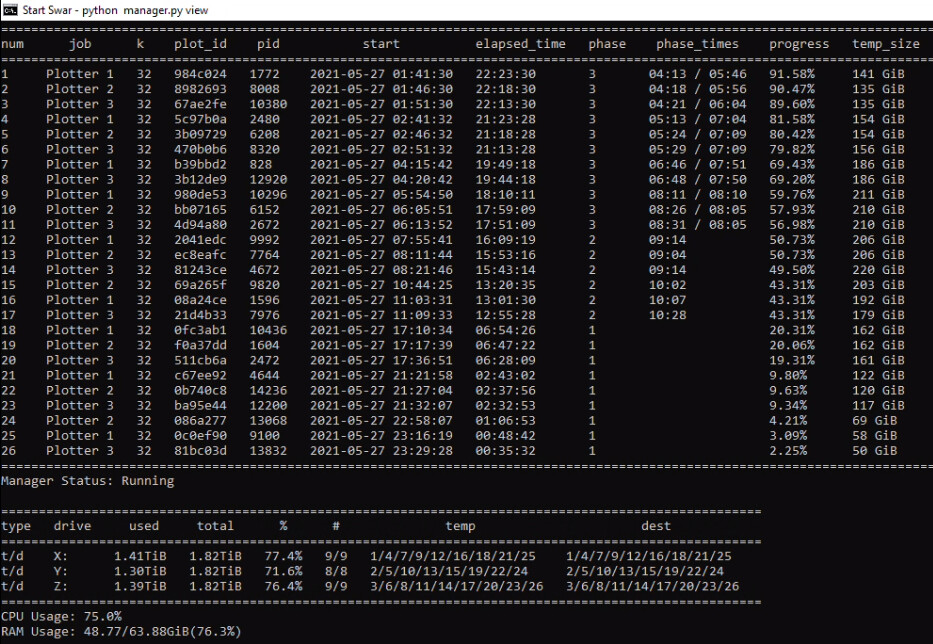
attach a picture of the actual plot manager, all of your plots… what is your config? I wrote an incredibly lengthy response to you above and provided a detailed config for both plotman AND sw4r… 
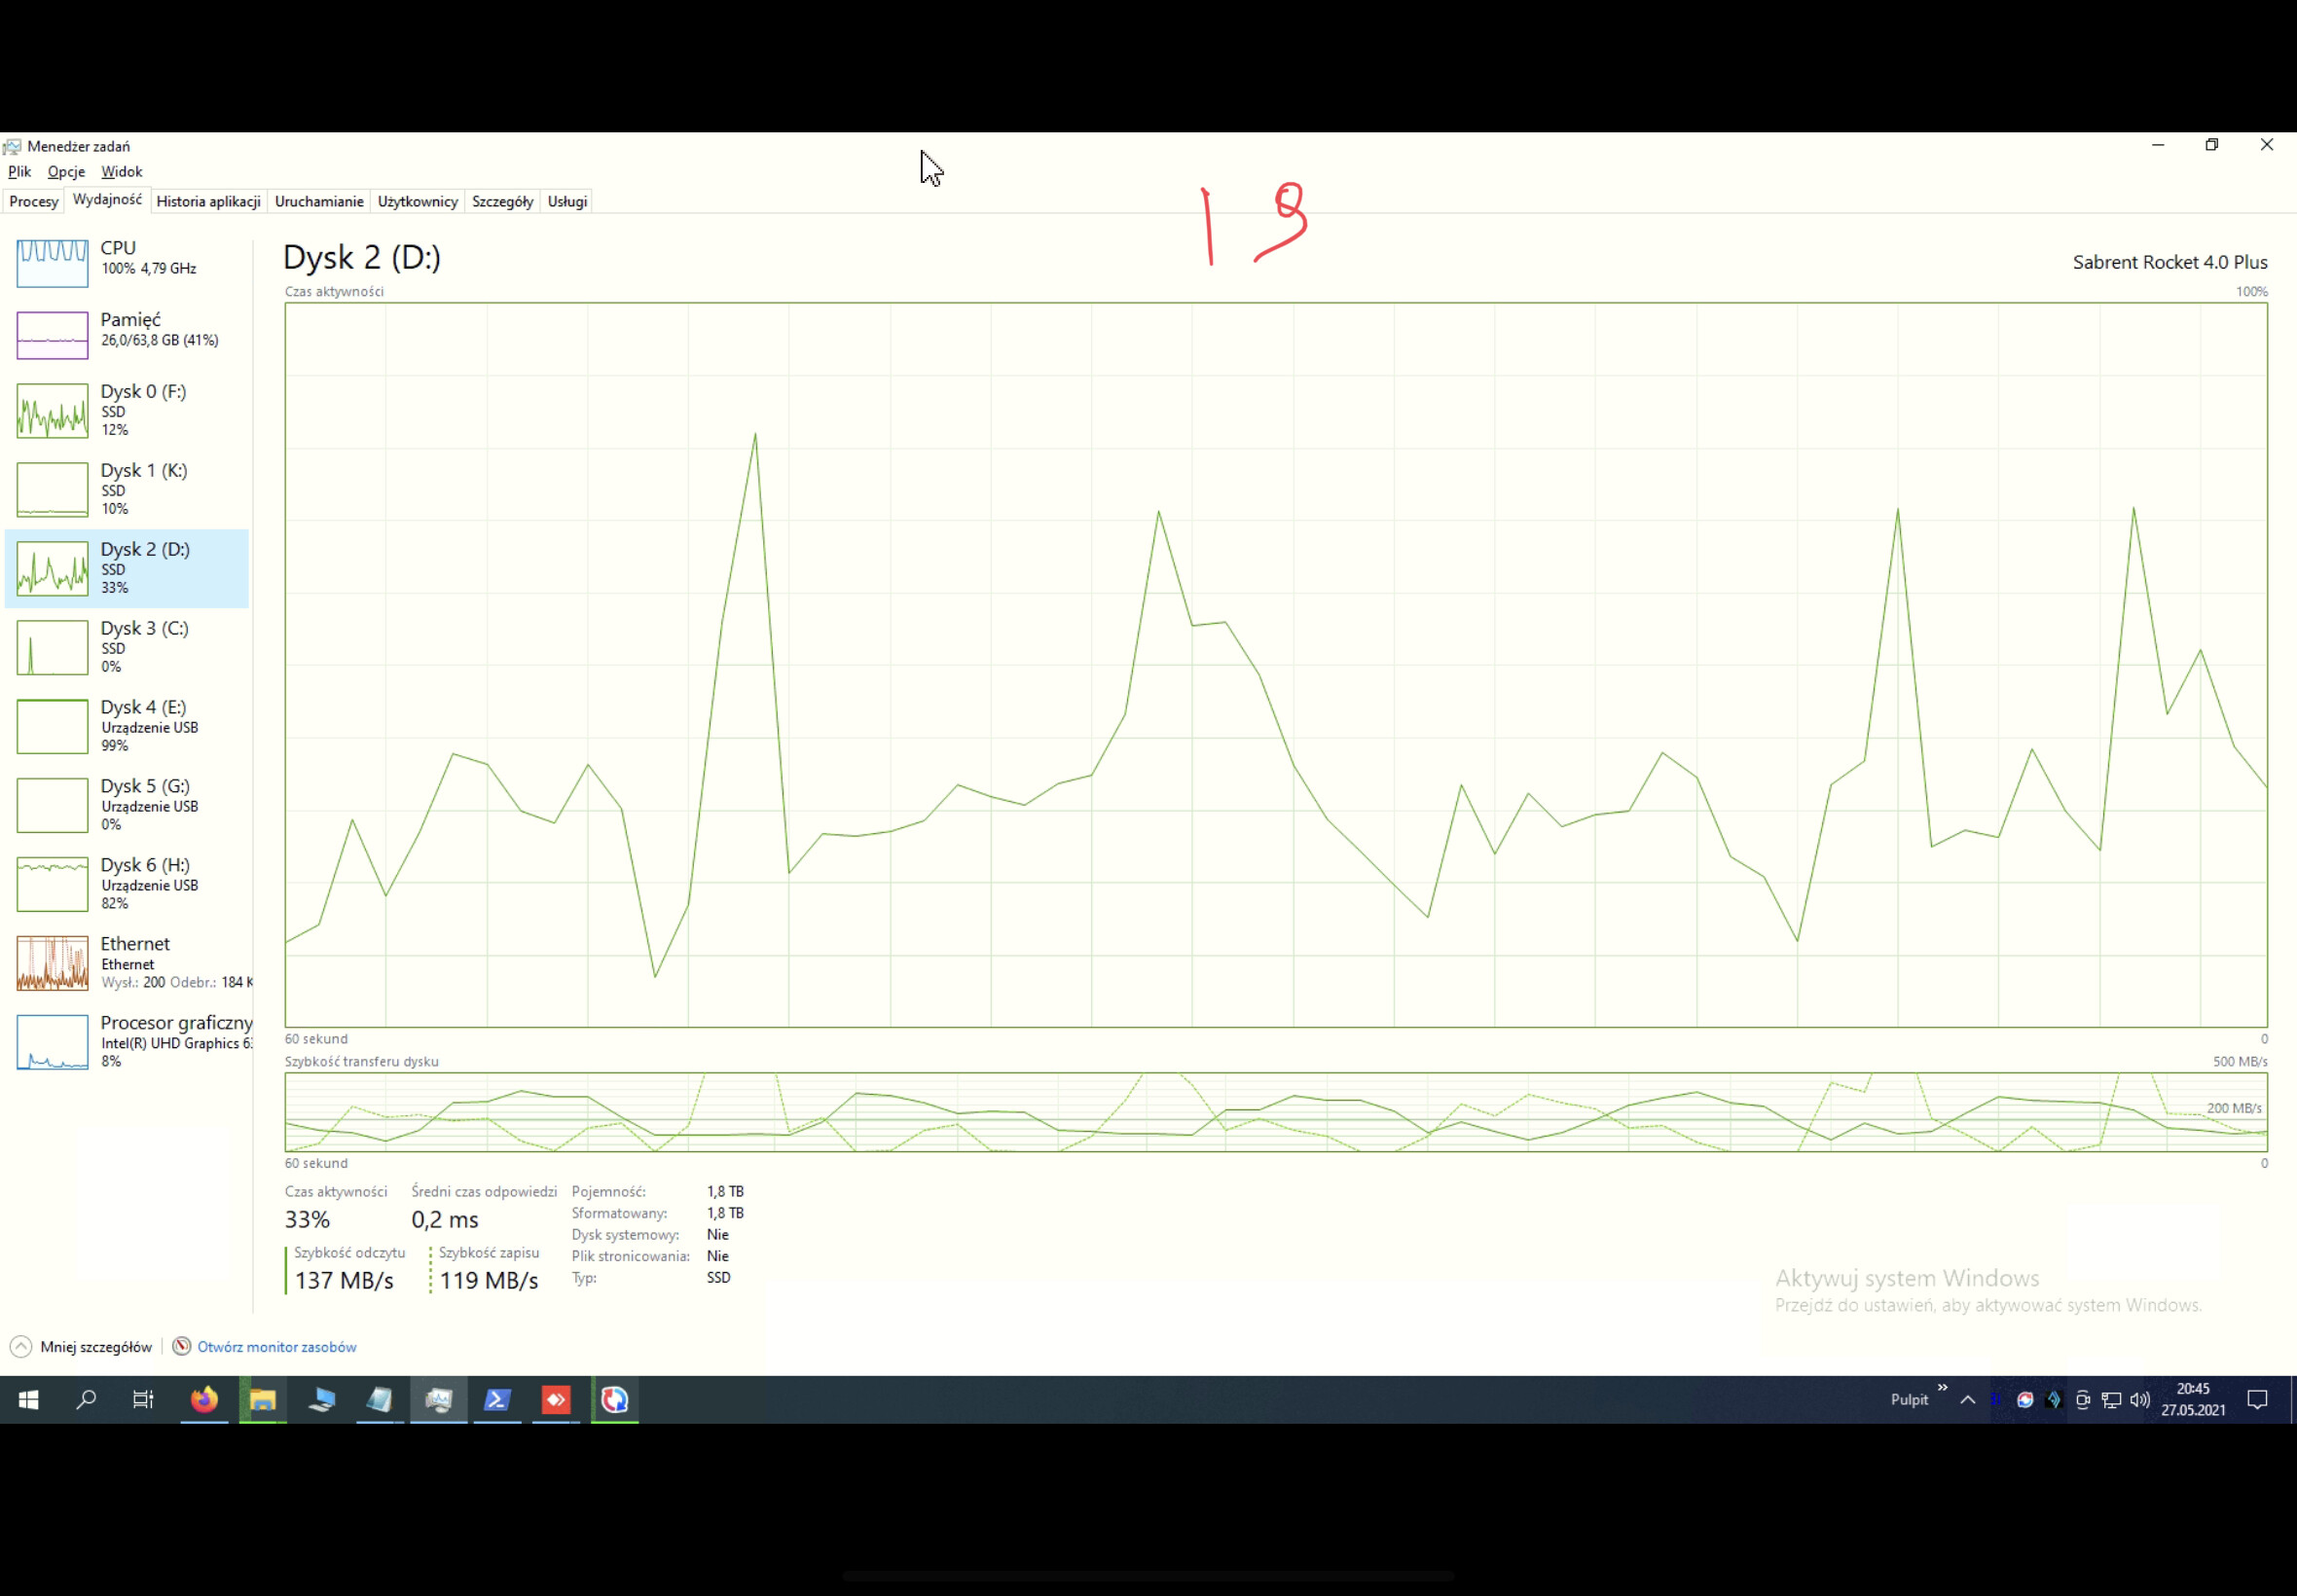
Look at your cpu… in the screenshots your xeon is at 24%… your i9 is maxed out… this really screams to me “configuration issue”… – its not the system… its how its set up im 99.999% sure of this.
1 Like
This is a single variable that should contain the location of your chia executable file. This is the blockchain executable.
WINDOWS EXAMPLE: C:\Users\Swar\AppData\Local\chia-blockchain\app-1.1.5\resources\app.asar.unpacked\daemon\chia.exe
LINUX EXAMPLE: /usr/lib/chia-blockchain/resources/app.asar.unpacked/daemon/chia
LINUX2 EXAMPLE: /home/swar/chia-blockchain/venv/bin/chia
MAC OS EXAMPLE: /Applications/Chia.app/Contents/Resources/app.asar.unpacked/daemon/chia
chia_location: C:\Users\ja\AppData\Local\chia-blockchain\app-1.1.6\resources\app.asar.unpacked\daemon\chia.exe
manager:
These are the config settings that will only be used by the plot manager.
check_interval: The number of seconds to wait before checking to see if a new job should start.
log_level: Keep this on ERROR to only record when there are errors. Change this to INFO in order to see more
detailed logging. Warning: INFO will write a lot of information.
check_interval: 60
log_level: ERROR
log:
folder_path: This is the folder where your log files for plots will be saved.
folder_path: C:\Plotter
view:
These are the settings that will be used by the view.
check_interval: The number of seconds to wait before updating the view.
datetime_format: The datetime format that you want displayed in the view. See here
for formatting: datetime — Basic date and time types — Python 3.9.5 documentation
include_seconds_for_phase: This dictates whether seconds are included in the phase times.
include_drive_info: This dictates whether the drive information will be showed.
include_cpu: This dictates whether the CPU information will be showed.
include_ram: This dictates whether the RAM information will be showed.
include_plot_stats: This dictates whether the plot stats will be showed.
check_interval: 60
datetime_format: “%Y-%m-%d %H:%M:%S”
include_seconds_for_phase: false
include_drive_info: true
include_cpu: true
include_ram: true
include_plot_stats: true
notifications:
These are different settings in order to notified when the plot manager starts and when a plot has been completed.
DISCORD
notify_discord: false
discord_webhook_url: https://discord.com/api/webhooks/0000000000000000/XXXXXXXXXXXXXXXXXXXXXXXXXXXXXXX
IFTTT, ref Webhooks works better with IFTTT, and this function will send title as value1 and message as value2.
notify_ifttt: false
ifttt_webhook_url: https://maker.ifttt.com/trigger/{event}/with/key/{api_key}
PLAY AUDIO SOUND
notify_sound: false
song: audio.mp3
PUSHOVER PUSH SERVICE
notify_pushover: false
pushover_user_key: xx
pushover_api_key: xx
TELEGRAM
notify_telegram: false
telegram_token: xxxxx
TWILIO
notify_twilio: false
twilio_account_sid: xxxxx
twilio_auth_token: xxxxx
twilio_from_phone: +1234657890
twilio_to_phone: +1234657890
instrumentation:
This setting is here in case you wanted to enable instrumentation using Prometheus.
prometheus_enabled: false
prometheus_port: 9090
progress:
phase_line_end: These are the settings that will be used to dictate when a phase ends in the progress bar. It is
supposed to reflect the line at which the phase will end so the progress calculations can use that
information with the existing log file to calculate a progress percent.
phase_weight: These are the weight to assign to each phase in the progress calculations. Typically, Phase 1 and 3
are the longest phases so they will hold more weight than the others.
phase1_line_end: 801
phase2_line_end: 834
phase3_line_end: 2474
phase4_line_end: 2620
phase1_weight: 33.4
phase2_weight: 20.43
phase3_weight: 42.29
phase4_weight: 3.88
global:
These are the settings that will be used globally by the plot manager.
max_concurrent: The maximum number of plots that your system can run. The manager will not kick off more than this
number of plots total over time.
max_for_phase_1: The maximum number of plots that your system can run in phase 1.
minimum_minutes_between_jobs: The minimum number of minutes before starting a new plotting job, this prevents
multiple jobs from starting at the exact same time. This will alleviate congestion
on destination drive. Set to 0 to disable.
max_concurrent: 20
max_for_phase_1: 16
minimum_minutes_between_jobs: 5
jobs:
These are the settings that will be used by each job. Please note you can have multiple jobs and each job should be
in YAML format in order for it to be interpreted correctly. Almost all the values here will be passed into the
Chia executable file.
Check for more details on the Chia CLI here: CLI Commands Reference · Chia-Network/chia-blockchain Wiki · GitHub
name: This is the name that you want to give to the job.
max_plots: This is the maximum number of jobs to make in one run of the manager. Any restarts to manager will reset
this variable. It is only here to help with short term plotting.
[OPTIONAL] farmer_public_key: Your farmer public key. If none is provided, it will not pass in this variable to the
chia executable which results in your default keys being used. This is only needed if
you have chia set up on a machine that does not have your credentials.
[OPTIONAL] pool_public_key: Your pool public key. Same information as the above.
temporary_directory: Can be a single value or a list of values. This is where the plotting will take place. If you
provide a list, it will cycle through each drive one by one.
[OPTIONAL] temporary2_directory: Can be a single value or a list of values. This is an optional parameter to use in
case you want to use the temporary2 directory functionality of Chia plotting.
destination_directory: Can be a single value or a list of values. This is the final directory where the plot will be
transferred once it is completed. If you provide a list, it will cycle through each drive
one by one.
size: This refers to the k size of the plot. You would type in something like 32, 33, 34, 35… in here.
bitfield: This refers to whether you want to use bitfield or not in your plotting. Typically, you want to keep
this as true.
threads: This is the number of threads that will be assigned to the plotter. Only phase 1 uses more than 1 thread.
buckets: The number of buckets to use. The default provided by Chia is 128.
memory_buffer: The amount of memory you want to allocate to the process.
max_concurrent: The maximum number of plots to have for this job at any given time.
max_concurrent_with_start_early: The maximum number of plots to have for this job at any given time including
phases that started early.
initial_delay_minutes: This is the initial delay that is used when initiate the first job. It is only ever
considered once. If you restart manager, it will still adhere to this value.
stagger_minutes: The amount of minutes to wait before the next plot for this job can get kicked off. You can even set this to
zero if you want your plots to get kicked off immediately when the concurrent limits allow for it.
max_for_phase_1: The maximum number of plots on phase 1 for this job.
concurrency_start_early_phase: The phase in which you want to start a plot early. It is recommended to use 4 for
this field.
concurrency_start_early_phase_delay: The maximum number of minutes to wait before a new plot gets kicked off when
the start early phase has been detected.
temporary2_destination_sync: This field will always submit the destination directory as the temporary2 directory.
These two directories will be in sync so that they will always be submitted as the
same value.
exclude_final_directory: Whether to skip adding destination_directory to harvester for farming
skip_full_destinations: When this is enabled it will calculate the sizes of all running plots and the future plot
to determine if there is enough space left on the drive to start a job. If there is not,
it will skip the destination and move onto the next one. Once all are full, it will
disable the job.
unix_process_priority: UNIX Only. This is the priority that plots will be given when they are spawned. UNIX values
must be between -20 and 19. The higher the value, the lower the priority of the process.
windows_process_priority: Windows Only. This is the priority that plots will be given when they are spawned.
Windows values vary and should be set to one of the following values:
- 16384 (BELOW_NORMAL_PRIORITY_CLASS)
- 32 (NORMAL_PRIORITY_CLASS)
- 32768 (ABOVE_NORMAL_PRIORITY_CLASS)
- 128 (HIGH_PRIORITY_CLASS)
- 256 (REALTIME_PRIORITY_CLASS)
enable_cpu_affinity: Enable or disable cpu affinity for plot processes. Systems that plot and harvest may see
improved harvester or node performance when excluding one or two threads for plotting process.
cpu_affinity: List of cpu (or threads) to allocate for plot processes. The default example assumes you have
a hyper-threaded 4 core CPU (8 logical cores). This config will restrict plot processes to use
logical cores 0-5, leaving logical cores 6 and 7 for other processes (6 restricted, 2 free).
-
name: G
max_plots: 999
farmer_public_key:
pool_public_key:
temporary_directory: G:\plot
destination_directory: H:\plots
size: 32
bitfield: true
threads: 4
buckets: 128
memory_buffer: 4600
max_concurrent: 7
max_concurrent_with_start_early: 8
stagger_minutes: 60
max_for_phase_1: 4
concurrency_start_early_phase: 2
concurrency_start_early_phase_delay: 0
temporary2_destination_sync: false
exclude_final_directory: false
skip_full_destinations: false
unix_process_priority: 10
windows_process_priority: 32
enable_cpu_affinity: false
cpu_affinity: [ 0, 1, 2, 3, 4, 5 ] -
name: F
max_plots: 999
farmer_public_key:
pool_public_key:
temporary_directory: F:\plot
destination_directory: H:\plots
size: 32
bitfield: true
threads: 4
buckets: 128
memory_buffer: 4600
max_concurrent: 1
max_concurrent_with_start_early: 1
stagger_minutes: 1
max_for_phase_1: 1
concurrency_start_early_phase: 4
concurrency_start_early_phase_delay: 0
temporary2_destination_sync: false
exclude_final_directory: false
skip_full_destinations: false
unix_process_priority: 10
windows_process_priority: 32
enable_cpu_affinity: false
cpu_affinity: [ 0, 1, 2, 3, 4, 5 ] -
name: D
max_plots: 999
farmer_public_key:
pool_public_key:
temporary_directory: D:\plot
destination_directory: H:\plots
size: 32
bitfield: true
threads: 4
buckets: 128
memory_buffer: 4600
max_concurrent: 1
max_concurrent_with_start_early: 1
stagger_minutes: 1
max_for_phase_1: 1
concurrency_start_early_phase: 2
concurrency_start_early_phase_delay: 0
temporary2_destination_sync: false
exclude_final_directory: false
skip_full_destinations: false
unix_process_priority: 10
windows_process_priority: 32
enable_cpu_affinity: false
cpu_affinity: [ 0, 1, 2, 3, 4, 5 ] -
name: I
max_plots: 999
farmer_public_key:
pool_public_key:
temporary_directory: I:\plot
destination_directory: H:\plots
size: 32
bitfield: true
threads: 4
buckets: 128
memory_buffer: 4600
max_concurrent: 1
max_concurrent_with_start_early: 1
stagger_minutes: 3
max_for_phase_1: 1
concurrency_start_early_phase: 2
concurrency_start_early_phase_delay: 0
temporary2_destination_sync: false
exclude_final_directory: false
skip_full_destinations: false
unix_process_priority: 10
windows_process_priority: 32
enable_cpu_affinity: false
cpu_affinity: [ 0, 1, 2, 3, 4, 5 ] -
name: E
max_plots: 999
farmer_public_key:
pool_public_key:
temporary_directory: E:\plot
destination_directory: H:\plots
size: 32
bitfield: true
threads: 4
buckets: 128
memory_buffer: 4500
max_concurrent: 1
max_concurrent_with_start_early: 1
stagger_minutes: 5
max_for_phase_1: 1
concurrency_start_early_phase: 2
concurrency_start_early_phase_delay: 0
temporary2_destination_sync: false
exclude_final_directory: false
skip_full_destinations: false
unix_process_priority: 10
windows_process_priority: 32
enable_cpu_affinity: false
cpu_affinity: [ 0, 1, 2, 3, 4, 5 ] -
name: K
max_plots: 999
farmer_public_key:
pool_public_key:
temporary_directory: K:\plot
destination_directory: H:\plots
size: 32
bitfield: true
threads: 4
buckets: 128
memory_buffer: 4500
max_concurrent: 1
max_concurrent_with_start_early: 1
stagger_minutes: 7
max_for_phase_1: 1
concurrency_start_early_phase: 2
concurrency_start_early_phase_delay: 0
temporary2_destination_sync: false
exclude_final_directory: false
skip_full_destinations: false
unix_process_priority: 10
windows_process_priority: 32
enable_cpu_affinity: false
cpu_affinity: [ 0, 1, 2, 3, 4, 5 ]
what you xeon motherboard ? Why my SSD NVME have working about 10-30%
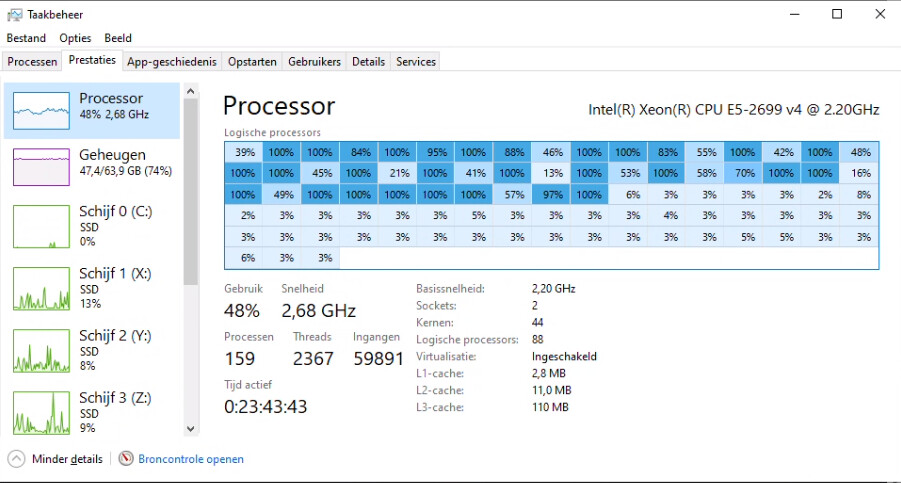
why the CPU is not working around 100%? maybe the bios is wrongly set? CPU temperature around 75 degrees Celsius
Thank God you are here! Lol
I bought 2 T7810s and loaded them up with dual E5 2699v4 processors and 64 gigabytes of RAM in each. I have two Samsung Pro 970s in those M2 adapters in each and am getting crazy slow results. I did not RAID them as I hear conflicting info on that. I am getting 14 plots a day on average per unit.
Here is my SWAR config for the two drives in one: Any insight you have would be greatly appreciated!
-
name: Y
max_plots: 999
farmer_public_key:
pool_public_key:
temporary_directory: Y:\Chia
temporary2_directory:
destination_directory: E:\Plots
size: 32
bitfield: true
threads: 8
buckets: 128
memory_buffer: 5000
max_concurrent: 7
max_concurrent_with_start_early: 7
stagger_minutes: 60
max_for_phase_1: 2
concurrency_start_early_phase: 4
concurrency_start_early_phase_delay: 0
temporary2_destination_sync: false- name: Z
max_plots: 999
farmer_public_key:
pool_public_key:
temporary_directory: Z:\Chia
temporary2_directory:
destination_directory: E:\Plots
size: 32
bitfield: true
threads: 8
buckets: 128
memory_buffer: 5000
max_concurrent: 7
max_concurrent_with_start_early: 7
stagger_minutes: 60
max_for_phase_1: 2
concurrency_start_early_phase: 4
concurrency_start_early_phase_delay: 0
temporary2_destination_sync: false
- name: Z
PS: Love your channel!
1 Like
Those pro drives are fast you should be getting about 16 plots per day per 2TB nvme drive – you could change the max concurrent to 8 per drive and max for phase 1 from 2 to 4 (assuming they are 2TB drives) … what slots are the nvme drives in? What adapter did you use? above in this thread a guy realized his slowness was his adapter as well… how long do the plots take?"
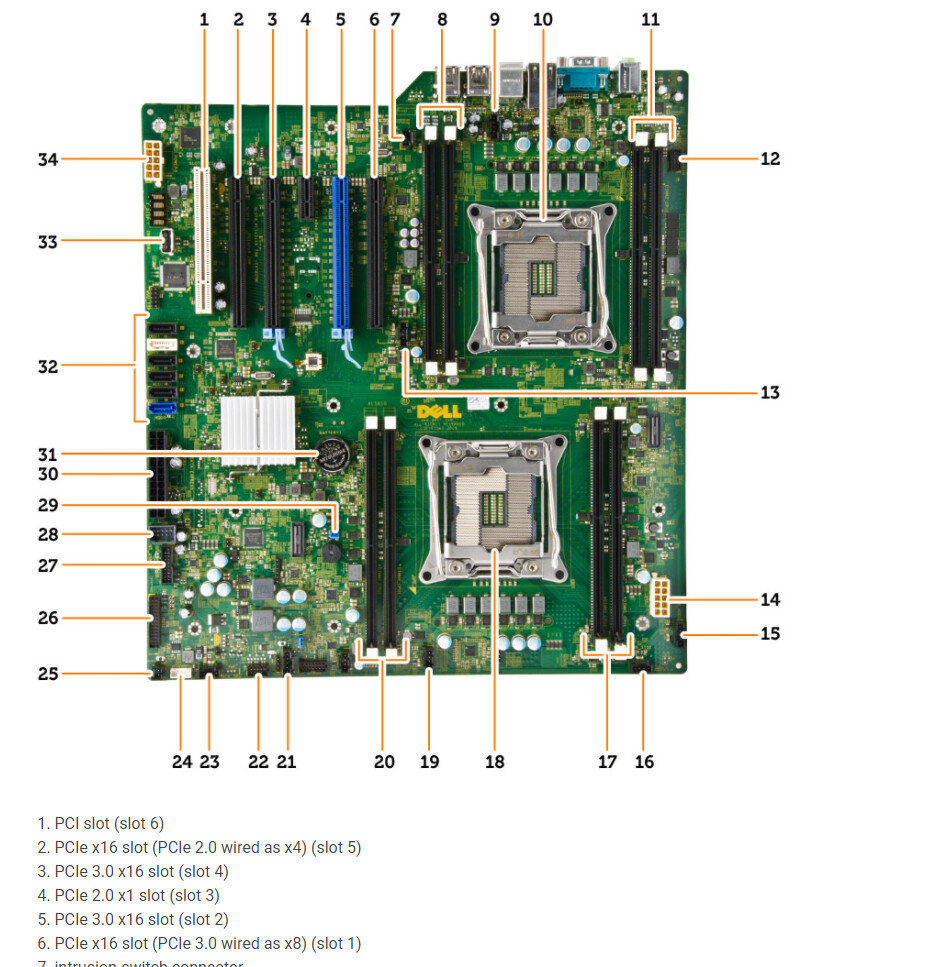
They are 2TB drives and I am using the Riitop adapters you recommended from Amazon. The adapters with drives are in slots 1 and 3. I believe the video card is in 2. The plots are taking about 14 hours.
Slow? wait till you see mine, lol…
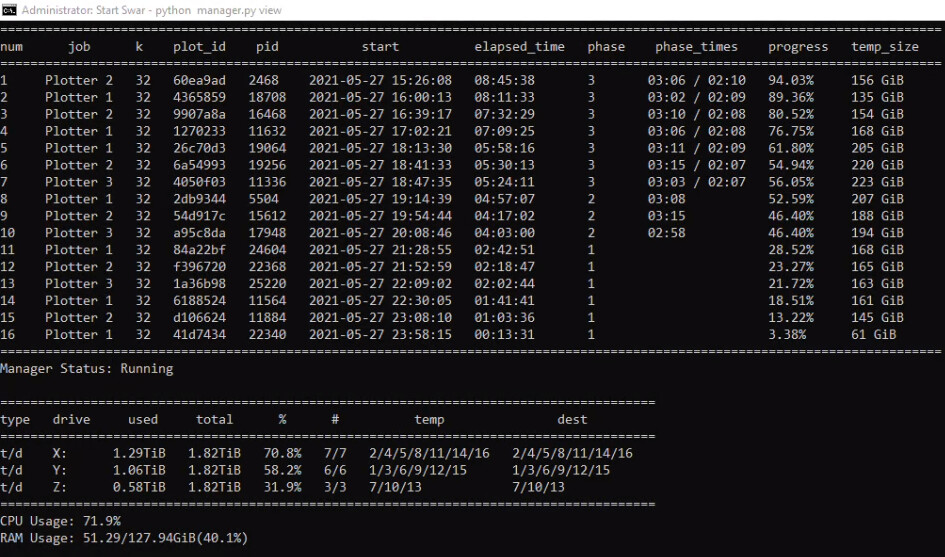
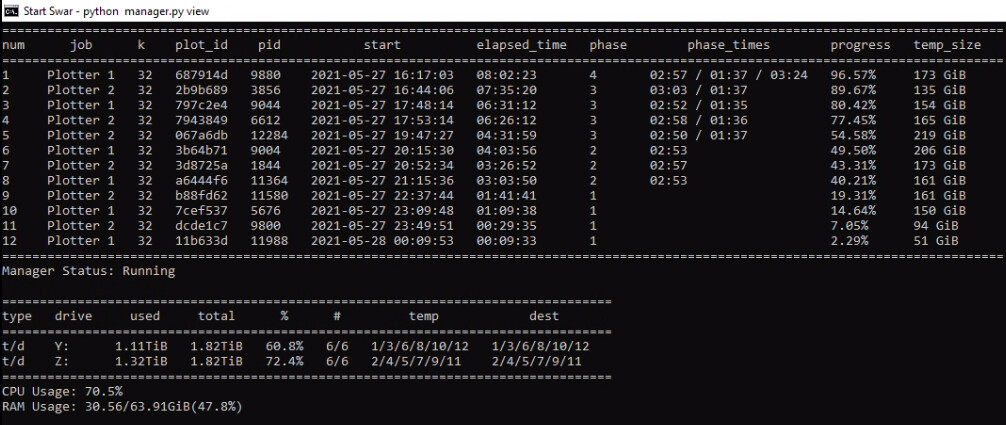
One of my recently built plotters with 2 x E5-2699v4, single 64GB 2400MHz stick, 3x 2TB 890 evo pro nvme (which I think is not in good shape):
My 5950x (which can also be improved) with 128GB 3200MHz, 3 x 2TB nvme:
My 3900x with 64GB 3600MHz, 2 x 2TB nvme:
Now my E%-2699v4 build, i first bought second hand ram (4 x 32GB 2400MHz) sticks which continiously crashed windows. after testing with memtest86 i found out that all 4 of them gave ECC errors. Then I bought a 16GB stick (2133MHz) and it did quite well (sorry, dont have screenshot). Now I got several sticks from the seller who sold me the 4 x 32GB sticks. I tested these 12 sticks (4 x 64GB & 8 x 32GB), 6 x 32GB gave ECC errors, 1 x 64 GB and 1 x 3GB sticks didnt give any error and the rest just keps freezing the bootloading or during the test. I THINK that the current 64GB is also in a bad shape, although I tested it and didnt give me any error. Especially if its performing worse than the 16GB 2133MHz stick which I bought.
As you can see, my temp drives and cpu’s aren’t bottlenecking:
So I ordered 3 x 16GB sticks with the same part numbers from a proper server store. I hope this bad performance is purely because of the ram. Let’s see.
have you tried running this in ubuntu? I have a few systems with more than 80 threads… they CRAWL in windows… and scream in linux. Literally 14 hour plots with 24 plots running in Windows 10, or Windows server … and in ubuntu or centos – 7-8 hour plots with 48 running simultaneously… same machine. no exaggeration.
I have no idea why this is… but windows seems absolutely terrible once you hit a certain number of cores.
EDIT: That said – i bet it is your ram
1 Like
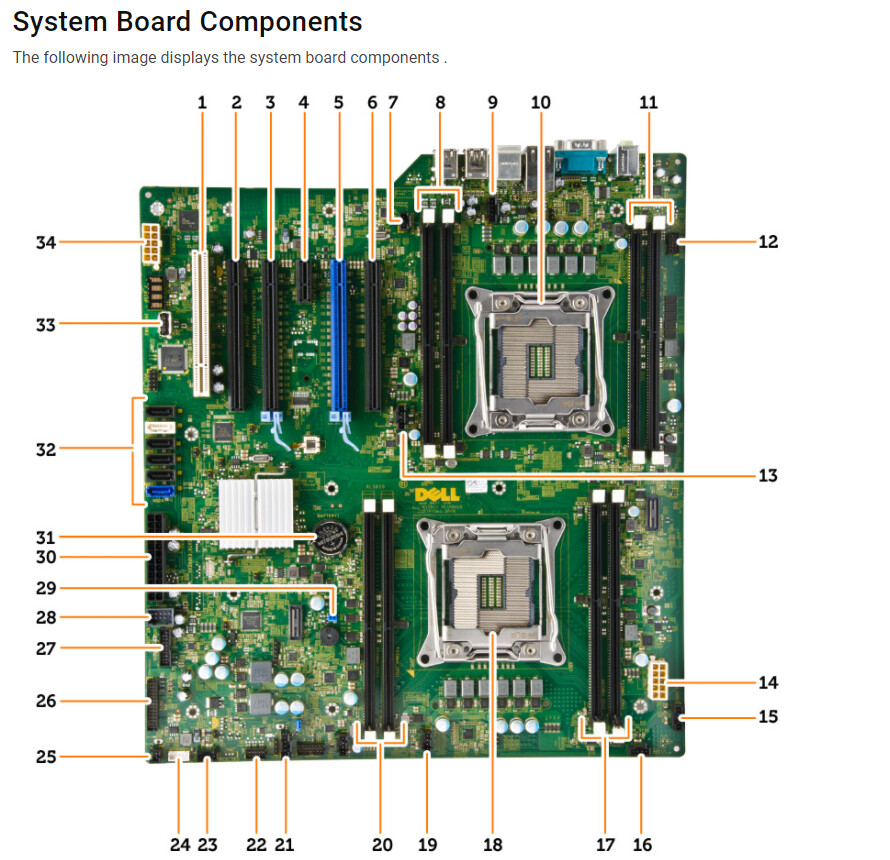
Oh. oops. 7 and 3. I had them backwards. Should they be in the lowest spots possible? I dont think mine will fit in number 1.
sorry 6 and 3 braindead
Whoops it cut off the bottom of the pic – i was just trying to make sure you weren’t usingthe pci2.0 slot… does your side panel have a diagram? I cant remember off the top of my head – are any of the PCIe slots connected via “PCH” on the diagram on the inside of the side panel? you deff dont want to use those slots.
I have absolutely no experience runnign linux, I watched some video’s on how to install chia in ubuntu, but cant find any videos on how to install and run/manage plotman or swar. So im waiting for that so I can try it out
Getting the ram tomorrow, so fingers crossed 
Positions 3 and 5 officially not PCH labeled CPU.
perfect – those are the simple things to check. Now you move to more complicated things… when youre plotting what are your phase times? What is the cpu utilization throughout the plotting process during a day? does it sit at 100% non stop? Have you tried plotting to one of the two drives without plotting to the other and then checking times?
Have you tried fewer plots ? when does it start to slow down – Ie: have you tried running with 2 plots per drive, checking times, adding plot by plot to see at what point it starts to take a long time?
1 Like
With the 64GB 2400MHz:
It starts around 3,5 hrs for the first plot and increases after every next plot, not its at 10,5 hrs for the most recent plot which finished phase one. I noticed that the second and especially the third phase is slowed down alot aswell.
CPU utelization is hovering around 49% at the moment. Never went above it (plotting 26 plots)
I actually had these temp drives in my 5950x plotter, so theyre good. still never at 100% aswell.
With 16GB 2133MHz /w same 3 nvme drives:
When I ran this with 1 x 16GB ram (at 2133mhz, lower than the current 2400mhz), it gave better times. Unfortunately no times recorded, but I it gave me 14 plots a day (cpu utelization was hovering around 25%-30% and ram around 12-13,5 GB.
Running 2 plots per drive still increased the timings
ps - i hope to learn how to plot on ubuntu soon with plotman or swar, so I can run all 3 plotters of mine on ubuntu. 10% increase would mean about 10 plots a day more for just the other 2 plotters
I was able to grab a Dell R730 with the following:
Dual Xeon E5-2680 v3 (24 cores, 48 threads total)
128GB PC4-2133 DDR4 ECC RAM
15x Seagate BarraCuda ST5000LM000 5TB 2.5" SATAIII 6Gbps 5400RPM HDD
I’ve just now installed 4x Seagate FireCuda 510 2TB M.2 NVMe onboard a Dell Ultra Speed PCIe 3.0 16x M.2 PCIe Adapter (using x4/x4/x4/x4 Bifurcation)
Any suggestions on SWAR config for this particular setup? Here’s what I have currently:
  max_concurrent: 32
  max_for_phase_1: 12
  minimum_minutes_between_jobs: 45
/
  - name: XEON-RIG
    max_plots: 999
    farmer_public_key:
    pool_public_key:
    temporary_directory:
      - /mnt/nvme01
      - /mnt/nvme02
      - /mnt/nvme03
      - /mnt/nvme04
    temporary2_directory:
    destination_directory:
      - /mnt/hdd01
      - /mnt/hdd02
      - /mnt/hdd03
      - /mnt/hdd04
      - /mnt/hdd05
      - /mnt/hdd06
      - /mnt/hdd07
      - /mnt/hdd08
      - /mnt/hdd09
      - /mnt/hdd10
      - /mnt/hdd11
      - /mnt/hdd12
      - /mnt/hdd13
      - /mnt/hdd14
      - /mnt/hdd15
    size: 32
    bitfield: true
    threads: 4
    buckets: 128
    memory_buffer: 3408
    max_concurrent: 32
    max_concurrent_with_start_early: 32
    initial_delay_minutes: 0
    stagger_minutes: 45
    max_for_phase_1: 12
    concurrency_start_early_phase: 4
    concurrency_start_early_phase_delay: 0
    temporary2_destination_sync: false
    exclude_final_directory: false
    skip_full_destinations: true
    unix_process_priority: 10
    windows_process_priority: 32
    enable_cpu_affinity: false
cpu_affinity: [ 0, 1, 2, 3, 4, 5, 6, 7, 8, 9, 10, 11, 12, 13, 14, 15, 16, 17, 18, 19, 20, 21, 22, 23, 24, 25, 26, 27, 28, 29, 30, 31, 32, 33, 34, 35, 36, 37, 38, 39, 40, 41, 42, 43, 44, 45, 46, 47 ]Digressing slightly (but hopefully relevant), PCIe slot 6 says ‘wired as x8’. Does this mean the slot is x16 or x8? I.e., will be capable of 128 GT/s (15.75 GB/s) or 64 GT/s (7.88 GB/s)?