Myth BuSters - Compressed C8 vs official plots profitability/wattage study (FlexPool)

UPDATE 2023-05-19 profit ratio XCH/kWh/TiB; HDD ROI comparison
UPDATE 2023-05-18 FlexFarmer v2.4.1 reduced intervals between disk access burst; no change in profitability; added per TiB comparison
UPDATE 2023-05-15 error in official chia farm wattage; profitability update; simplifying results; Double-tripe vision at the end
UPDATE 2023-05-14 energy confusion explained, added dev fees.

!!! WARNING this study may cause severe head aches, mental diarrhoea, and broken dreams !!! We deal with facts, use it or leave it if you have no idea.

YOU CAN BE RIGHT OR DO IT RIGHT…THIS IS THE WAY

We all heard the miracles of compressed plots, claiming up to 47.2% boost in income. One wonders how the author of the post came up with this number in the first place - 68.9GiB mmx C9 / 101.3GiB official = ~ 32% less space than official.

I prefer to do math, numbers never lie. As Albert used to say, “What works in theory, doesn’t work in reality. And vice versa.”

  1. official plots, 7454 plots, 737.77TiB, plot costs 0.05CHF/plot, pool. space

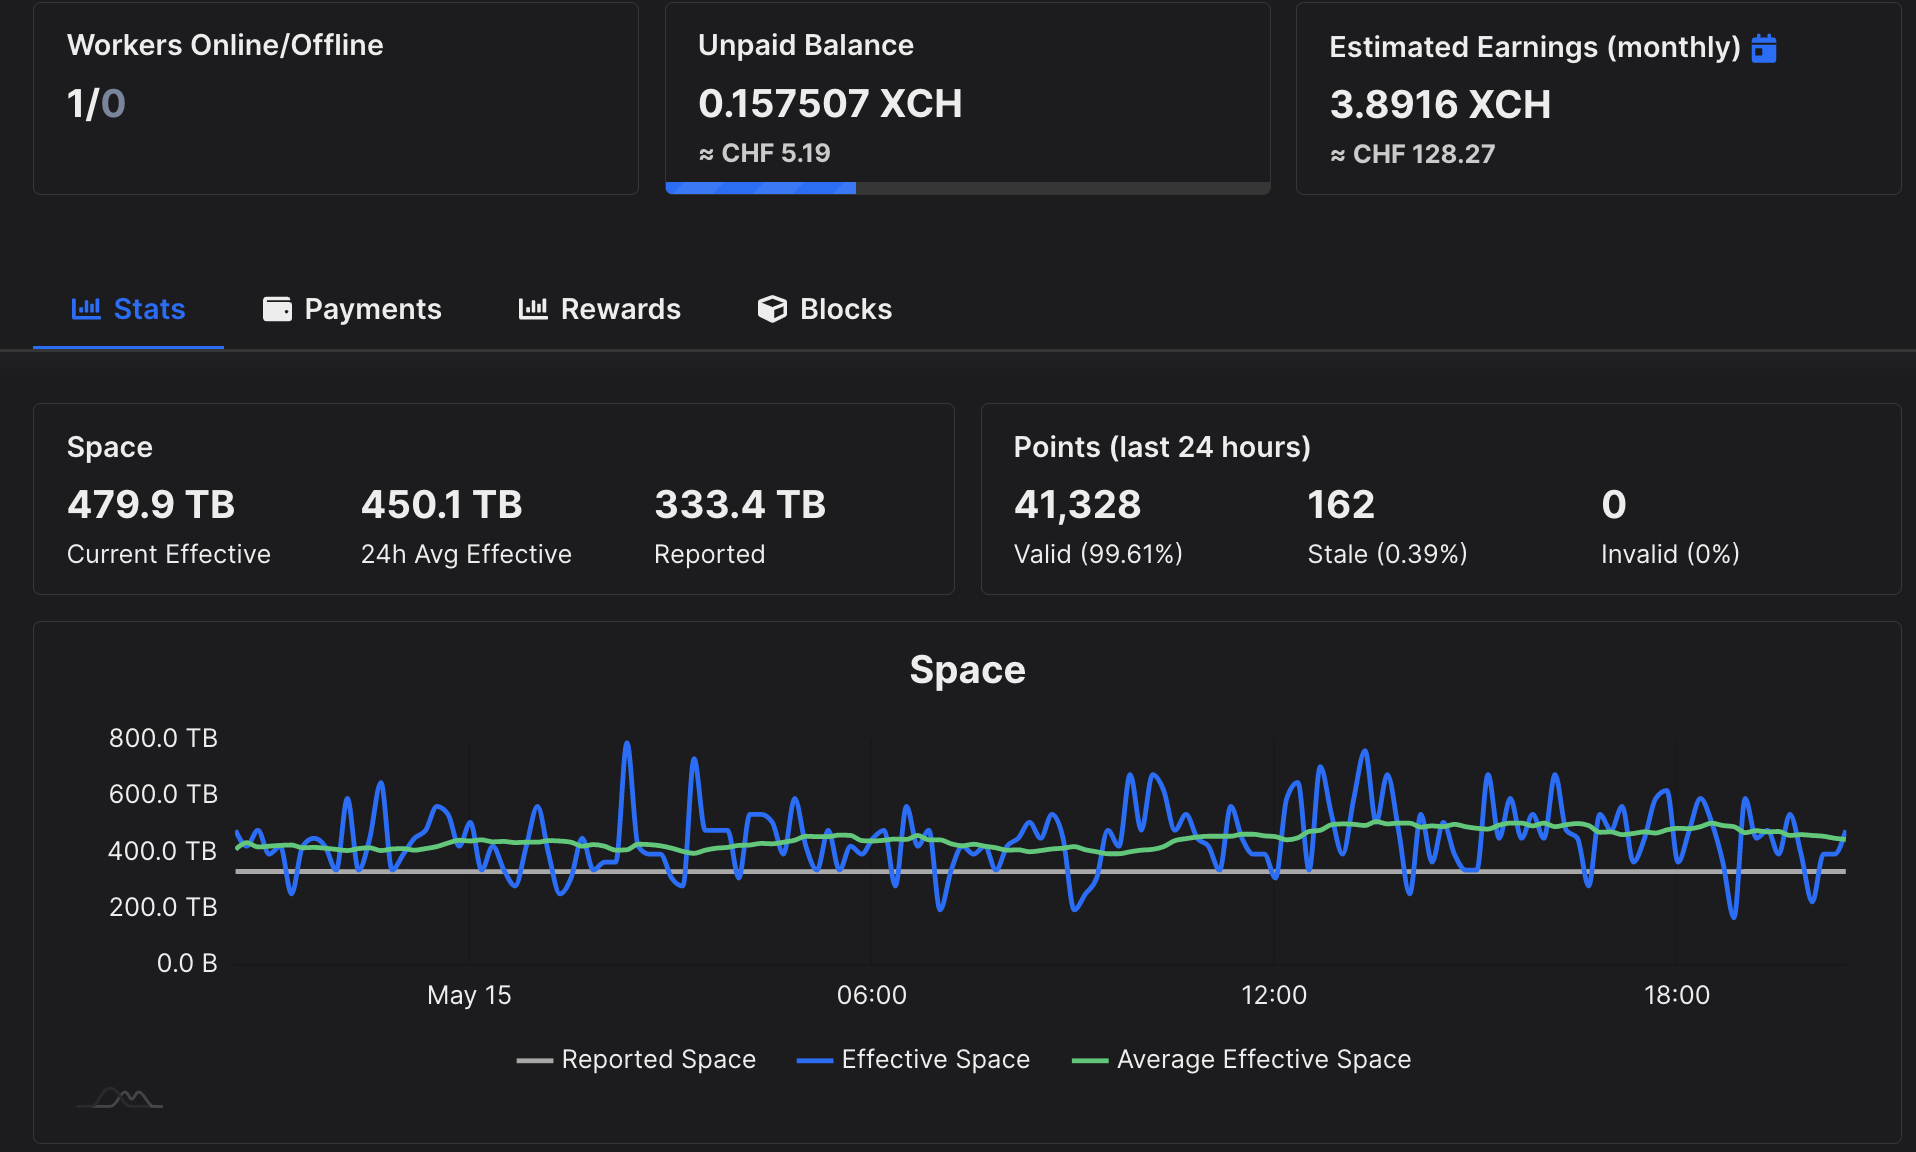
  2. mmx-v2.4 C8 plots, 4355 plots, space=333.35TB/303.18TiB space-effective=474.25TB/431.33TiB, plot costs <0.01CHF/plot, nVidia Quadro M4400 (120W TDP, wattage 40-90W during farming), FlexFarmer v2.4.1, pool difficulty 18

Fundamentals/theory/assumptions/errors

  • INCOME = NET REWARDS from pool/solo (including fees)
  • PROFIT = INCOME - COSTS
  • earnings should be same as official plots -3.125% dev fee
  • earnings per TiB should be ~30% higher than the official -3.125% dev fee
  • poor earnings suggest problem between plot/pool. Gigahorse guys can share results
  • rewards after 30 hours of farming - effective avg 24h 448.3 TiB @ 3.8764 XCH with 103.93% luck. Long-term, we will see 100% luck. Thus, rewards corrected for 100% luck or 3.7658 XCH - dev fee.
  • commonly used unit of electric energy kWh (used in utility bills) is of course kW used over the month period. wattage 0.3312 kWh/TiB/month was calculated ~200Wh * 24 hours * 30 days / 1000 for simple energy costs calculations
  • study is business oriented where investors are interested in ROI, ROIC. Once, we know cashflows, we can “hope” based on uncle Warren’s DCF.
  • investors do not rely on parents/boss to pay bills/HW, we use OPM for investing.
  • wattage measured with APC UPS at 1s intervals
  • rewards are long-term average of payments from pool (Flexpool is still not accurate)

Observations

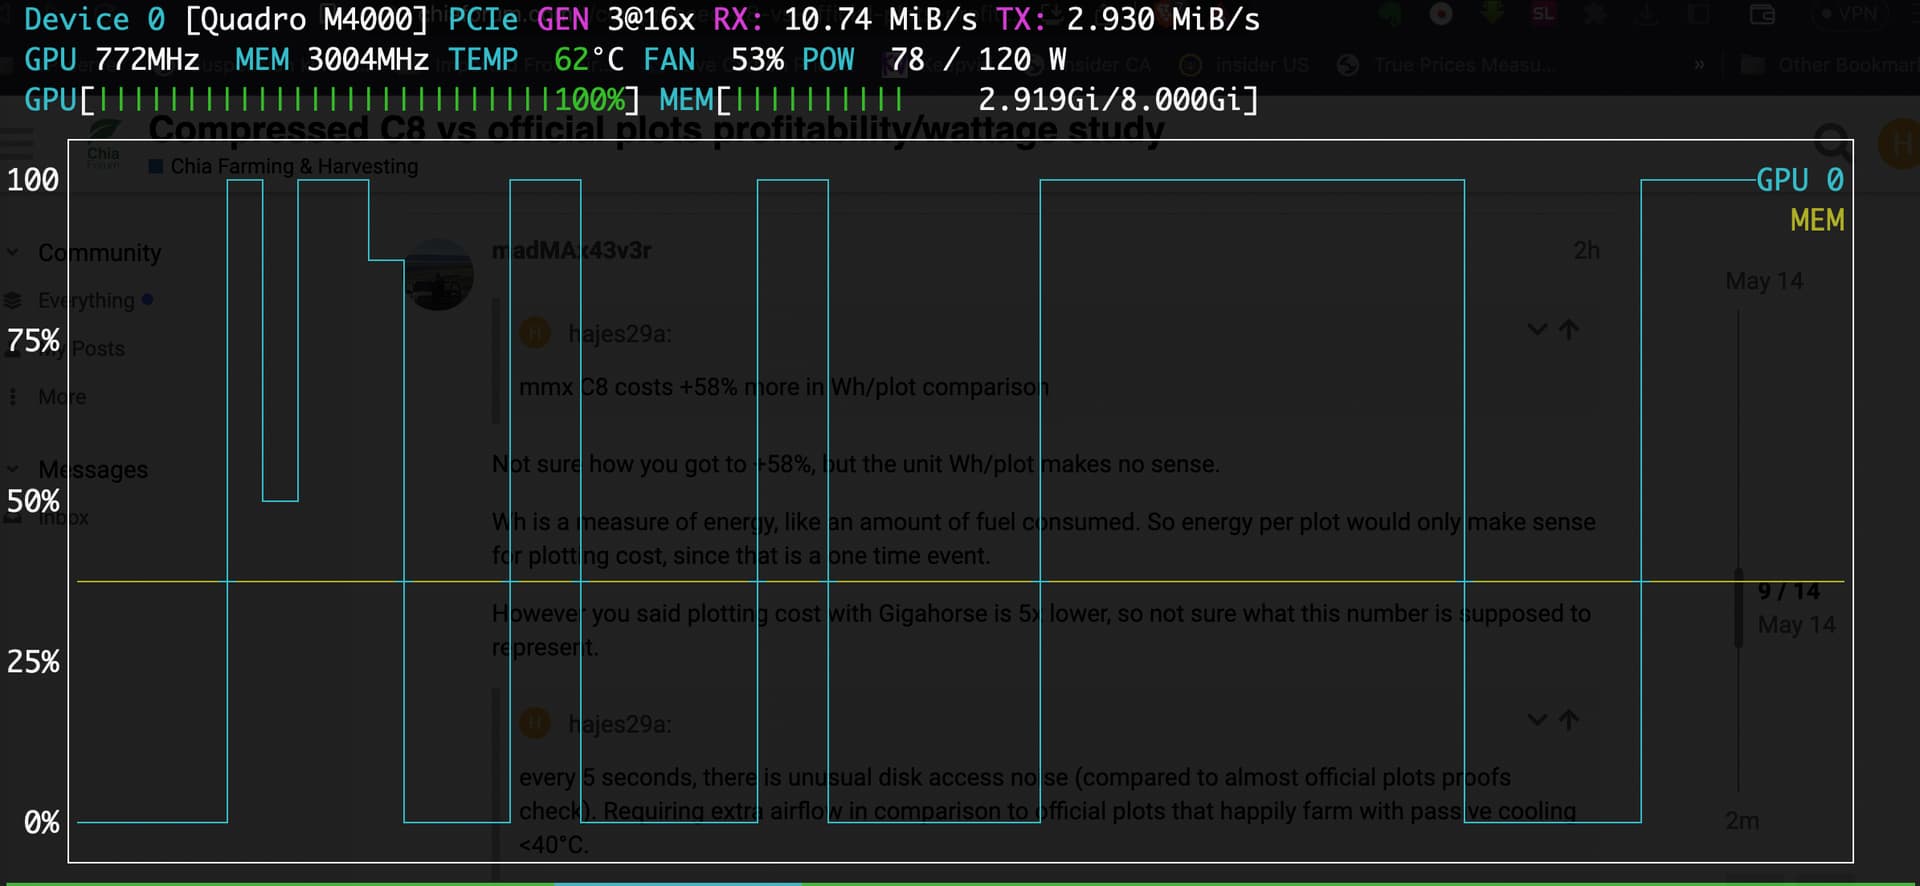
  • every 10 seconds (used to be around 5s), there is unusual burst disk access noise (compared to almost silent official plots). Requiring extra airflow in comparison to official plots that happily farm with passive cooling <40°C. MAY WEAR HDDs FASTER???
  • pool difficulty 1-20 where most power consumption occurs
  • farm is still too small to make it more interesting than official plots. Double or triple size may be more interesting for GPU farming

Data sets

official

  • plot costs 0.05CHF/plot (AMD 5950X @ 4.3GHz, 128GB RAM, Corsair MP600 2TB)
  • 7454 plots, 737.77TiB
  • over a year of real data based on amounts paid by pool, and APC UPS 1s readings
  • reward 0.010245195128382 XCH/TiB/month
  • reward 0.001014032413451 XCH/plot/month
  • wattage 0.029023128521599 kWh/plot/month
  • 0.034938770046954 XCH/kWh/TiB

mmx

  • 4355 plots, 431.33TiB (except for per TiB calculations where plot size is used)
  • plot costs <0.01CHF/plot (2x E5-2697v2, 512GB DDR3-1333)
  • reward 0.0120328476 XCH/TiB/month
  • reward 0.0008647072 XCH/plot/month (after dev fee)
  • wattage 0.033065442020666 kWh/plot/month
  • 0.0253341579 XCH/kWh/TiB

GPU farming Results

  • mmx C8 earns -14.73% per plot (should be only -3.125% less than official)
  • mmx C8 uses +13.93% more Wh/plot
  • mmx C8 earns +17.45% per TiB (plot size, not effective-space)
  • mmx C8 uses +62% more kWh/TiB/month (plot size, not effective-space)
  • mmx C8 earns -27.5% less XCH/kWh/TiB ratio
  • mmx C8 increased ROI for HDDs by 53% + GPU…no point to count further.

Money talks/ROI

XCH price 38 CHF is doom threshold for the most efficient HDDs on market (20TB @ 14CHF/TB). I seek the best watt/space/ROI ratio.

Even the mighty Swiss with allegedly 100% energy independence charge us 0.31CHF/kWh.

mmx free cashflow per plot 0.033 - 0.01(energy used)=+0.022 CHF/plot/month. 20TB drive fits 261 C8 plots = +5.74CHF/month or 49 months/4.1 years ROI just for HDD.

official plots free cashflow per plot = +0.04-0.006=+0.034 CHF/plot/month = +8.87CHF/month = 32months/<3 years.

Miracles of accounting magic

Some kids claim 2 years ROI with used/certified HDDs <12TB @ 7-9$/TB. HDD still uses 6-7Wh no matter size.

Lets say we got 10TB used drives with questionable durability, and remaining lifespan. 10TB costs same amount of watt as 20TB, and holds a half of plots, thus requiring double space. Johny McDonald’s usual household has got 380W/25A pulled from street power lines, usually split to 2x 230V @ 10A max (at least in Europe).

One has got 2300W cap, assuming you live in a shed and do not use a fridge, gaming PC, no TV, no nothing. About 2x 350 HDDs cap per household. Chia is really getting “green” nowadays…used hdds of any size, GPUs, mega-über-plotting-rigs using 500Wh ROFL

10TB is 130 C8 plots. Rewards +0.03-0.01=+0.02 FCF/plot/month = +2.6 CHF/month. Lets say we got the average price 9 CHF/TB as I have usually seen in forums. ROI for such a drive is 35months/3 years

“Those who know do not talk, those who talk do not know.” Lao Tsu

“One does not speak unless one knows.” Mando :wink:

DO YOU WANT TO BE RIGHT OR RICH?

Of course, that is just ROI for HDDs…but wait those drives do not work on their own right?

Server + plotter + your time (average worker income in Swiss is <30 CHF/hour). Do you still wonder why there is no business interest in Chia :wink: It is a hobby for people that already spent >10´000 hours learning the computer trade in the last 30+ years…and we just wanna avoid brain muscle atrophy…while getting some “profit” along the way for the sake of future finance.

Double-tripe vision

Let’s dream for a while, simulate where is C8 more profitable. Max said doubling the farm size may use +30Wh on GPU.

double

  • 16 x 20 TB HDDs = 16 * 6.5Wh = 104Wh drives
    GPU +30Wh
    farm wattage ~334Wh
    8710 plots 862.66 TiB
    7.2962375 XCH/month (similar to my official Chia farm)

0.008386479885057 XCH/plot/month
0.027609644087256 kWh/plot/month

Almost same number of plots in comparison to the official chia farm. Wattage is now 4.87% lower (theoretically).

triple

  • 32 x 20 TB HDDs = 32 * 6.5Wh = 208Wh drives
    GPU +60Wh (GPU should run flat out 120W, 100% load now)
    farm wattage ~470Wh
    13065 plots 1293.99 TiB
    10.94435625 XCH/month

0.008386479885057 XCH/plot/month
0.025901262916188 kWh/plot/month

Almost same number of plots in comparison to the official chia farm. Wattage is now 10.76% lower (theoretically).

Still, there is something weird about plot profitability. According to Max, plot rewards should be the same. In other words, official plots and compressed plots should have the same reward - 3.125% fee. The only difference, plots use less space and large enough farms should have more profit.

2 Likes

Just Chill and farm with what you’ve got.
The real rewards come way later down the line…

3 Likes

that is wishful thinking aka hoping. My master used to say, “Hope is the worst investing strategy.”

2 Likes

I mined 0.5 BTC (with CPU) when it was at sub dollar value, I did the math at that time and concluded it was a waste of time/effort. I am not making that mistake twice :slight_smile:

5 Likes

Your math is flawed.

Explain to me why a C8 plot would earn 20% less XCH / month ?

The whole point of plot compression is to have a smaller plot with the same result. Every K32 is equal, no matter the compression level.

It’s not, the power draw difference between difficulty 100 and 1000 is almost zero. From 1 to 20 is where you save the most, it’s an exponential decay.

Just plain wrong.

You should also learn the difference between W and Wh, Wh is not Watt per hour, it’s Watt times hour. So a power draw of 10 Watt for one hour would be 10 Wh.

Based on your own claims for power usage, 0.2932 kWh/TiB/month for normal plots and 0.3312 kWh/TiB/month for C8 Gigahorse, we can say farming with C8 costs you 13% more in power per effective netspace.

Assuming that your uncompressed profit margin is 50% (ie. half the XCH farmed goes to pay power bill), we can say that C8 will increase your profit by: (100 + 42 - 3 - 13/2) / 100 = 1.325 = 132.5 % - 100 = 32.5 %

4 Likes

Well, what can I say about it, it’s a little funny when you accuse others that they bet on a rising value of chia and thus have a possible ROI of 2 years.
But in the same breath your whole calculation is based on the chia value staying the same in the next years.
No idea which of the two approaches now shows more cluelessness :wink:

Basically your numbers represent a good approach to calculate investments and costs and possible profit.

But i miss one point when you compare compressed plots with normal plots in terms of ROI.
And that is TCO in relation to the complete effective farm size of compressed to uncompressed plots, because that is the crucial point for the ROI.

With an investment of 200$-300$ you can easily increase your farm size to 140%. for a medium to large farm this is easily over 10k$ and more difference than buying 40% more HDDs. and these 40% more HDDs also consume much more than a GPU when farming, which not only reduces your total investment for a given farm size but also your running costs.

As you say: “math, numbers never lie” but the result depends on the context in which the numbers are used :wink:

have a nice weekend

MadMax explains this eloquently and clear as day. While we appreciate your research @hajes29a , you’re definitely complicating things!

I do share your observation on this, I too get unusual disk access, where every few seconds the whole array of disks reads at the same time for reasons unknown. But it doesn’t happen on every instance… if I restart my farmer for maintenance or other reasons, sometimes it doesn’t have the unusual disk access at all.

Make sure your plot refresh interval is not set to the default of 120 sec. Because that would cause this (I think, it depends on OS caching).

However it’s normal that every ~9 sec half your HDDs will see activity at the same time. For a HDD with 256 plots you have a 50% chance to have a plot pass filter on it.

Not sure how you got to +58%, but the unit Wh/plot makes no sense.

Wh is a measure of energy, like an amount of fuel consumed. So energy per plot would only make sense for plotting cost, since that is a one time event.

However you said plotting cost with Gigahorse is 5x lower, so not sure what this number is supposed to represent.

Obviously that’s not normal, and needs to be investigated.

Now this is just perfect.

1 Like

Regarding the disk IO issue, here is the access pattern for my RAID0 with 4x16 TB HDD which has 776 K32 C7 plots farming with Gigahorse 1.8.0.giga11:

$ dstat -d -D sda --disk-util --disk-tps
--dsk/sda-- sda- --dsk/sda--
 read  writ|util|#read #writ
  77k  228B|2.62|   6     0 
   0     0 |   0|   0     0 
   0     0 |   0|   0     0 
1344k    0 |36.8|  96     0 
   0     0 |   0|   0     0 
   0     0 |   0|   0     0 
   0     0 |   0|   0     0 
   0     0 |   0|   0     0 
   0     0 |   0|   0     0 
   0     0 |   0|   0     0 
   0     0 |   0|   0     0 
   0    16k|0.40|   0     1 
   0     0 |   0|   0     0 
   0     0 |   0|   0     0 
   0     0 |   0|   0     0 
   0     0 |   0|   0     0 
   0     0 |   0|   0     0 
   0     0 |   0|   0     0 
   0     0 |   0|   0     0 
   0     0 |   0|   0     0 
   0     0 |   0|   0     0 
1372k    0 |46.4|  98     0 
   0     0 |   0|   0     0 
   0     0 |   0|   0     0 
   0     0 |   0|   0     0 
   0     0 |   0|   0     0 
   0     0 |   0|   0     0 
   0     0 |   0|   0     0 
   0     0 |   0|   0     0 
   0     0 |   0|   0     0 
 440k    0 |16.4|  32     0 
   0     0 |   0|   0     0 
   0     0 |   0|   0     0 
   0     0 |   0|   0     0 
   0     0 |   0|   0     0 
   0     0 |   0|   0     0 
   0     0 |   0|   0     0 
   0     0 |   0|   0     0 
   0     0 |   0|   0     0 
   0     0 |   0|   0     0 
  12k    0 |1.60|   1     0 
   0  8192B|0.80|   0     2 
   0     0 |   0|   0     0 
   0     0 |   0|   0     0 
   0     0 |   0|   0     0 
   0     0 |   0|   0     0 
   0     0 |   0|   0     0 
   0     0 |   0|   0     0 
   0     0 |   0|   0     0 
 892k    0 |28.4|  65     0 
   0     0 |   0|   0     0 
   0     0 |   0|   0     0 
   0     0 |   0|   0     0 
   0     0 |   0|   0     0 
   0     0 |   0|   0     0 
   0     0 |   0|   0     0 
   0     0 |   0|   0     0 
   0     0 |   0|   0     0 
  88k    0 |5.20|   7     0 
1296k    0 |30.4|  86     0 
   0     0 |   0|   0     0 
   0     0 |   0|   0     0 
   0     0 |   0|   0     0 
   0     0 |   0|   0     0 
   0     0 |   0|   0     0 

It’s one second per line, we can see the read access every ~9 sec, sometimes no plot passed the filter, sometimes 1 or 2 or 3, etc.

It looks like around 32 IO requests per lookup, pretty much as expect. Uncompressed would be around 12. But that 3x increase should hardly matter since the disks are still more than 95% idle.

Keep in mind a single plot can have multiple proofs per challenge, so it can happen that 3 plots pass the filter and each has 3 proofs, giving us a total of 9 lookups.

2 Likes

oh boy, that make my day…10W times hour is not 10Wh ROFL What you basically saying “HDD uses on average 6.5W * 60min/1 hour = 390Wh” no?

I use kWh because that is how you pay for your electricity bills

what should I say Max. This is the way. Numbers are here, take it or leave. I have calculated all on a per plot basis, so there is no confusion with compressed, effective space, uncompressed and so on.

Numbers are taken from APC UPS with 1s interval. Aka pulled from the wall. Profit is taken from pool payments average. If you don’t like it, complain to evil APC wall readings, and pools that rip us off ROFL

I am just a messenger.

If your rig pulls ~200Wh for 4500 plots. You can invent new math formulas, or use brain. 200/4500. Simple math my neighbour’s 10y old daughter can do.

It is nice your plots are smaller, but they use many times more energy per plot. Official plots use always 50-70Wh overhead for running server…It is same for 3’000 or 100’000.

Compression has got the usual 50-70Wh server overhead + >50Wh for GPU. More plots, more GPU wattage. It may work if you are stretching your GPU to the limit with 3PiB for example.

As we discussed before, small farms are no go. That is the point of this experiment. Most kids should simply go for C4 where even the 10 years old Xeon makes more money than official plots.

Disk access correlates with GPU use

It calculates proofs or I do not know. I know, if I used pool difficulty 18 as suggested by flexpool. Wattage dropped like 10-20Wh for whole rig. I have seen your info about computing overhead with pool difficulty.

Disk access didn’t change. FlexMiner has no setting for plot checks. There may be issue on Flexpool side.

And when everyone’s using plot compression there won’t be any point, we’ll all be paying more to power our farms for the same estimated time to win we had before plot compression. :roll_eyes:

1 Like

This is the way, that’s why the most efficient always win…if you have a brain, you will be ahead of most farmers. Once, times of <20XCH come…as uncle Warren used to say “You don’t find out who’s been swimming naked until the tide goes out”

Even the most ignorant can earn by farming at >30$/XCH. I can go as low as 2$/XCH, and still make money.

1 Like

Highly doubtful everyone will though.
If you look at un-upgraded nodes, ppl still on OG plots and/or with Hpool.
My guess is 50% will have switched to compressed by the end of the year.

Nevertheless your point stands, in the end it increases power consumption while the benefits diminish.

I highly doubt there will be such a movement towards compression. space.pool is still largest pool, and there was no rapid outflow towards the unofficial compression. Chia netspace jumped slightly, but my guess is “granny started to use her peacemaker logging HDD for Chia farming” because XCH jumped to 45$…rug pull, and we are back…soon it will go below 30$. Kids still believe crypto will skyrocket this year.

Big smart players go for low risk, high income. Meaning official supported way. You do not replot 20PiB farm, if there is just 10% more profit. Plots are making money already. Only players that have all investment back, may take a dive.

Replotting did cost me 30CHF for 0.5PiB…with my time, let’s say 200CHF…with HW…experiments…we are at 1200+200 = 1400 CHF. You can still sell the HW…surely for 500CHF…still 700 CHF experiment.

Imagine there are kids spending 5000$ on EPYC super servers. They offer plotting service, while their boss pays the datacenter bills and HW.

your reply shows clues ness chief :wink:

That is the ROI, ROIC.

You know costs, and change XCH price…right here, right now with finite values. If you wish to dream, you do projections…same costs, rewards, just imaginary XCH price 5 years from now.

It is comparison per plot basis. Nothing more, nothing less. I started with an effective space comparison…chaos. If you make it simple…plots/energy used/rewards.

I tell you a little secret about this “incorrect” study - bad players of Chia paranoia in the last 2 months paid for 1/2 of HDDs in my server. You can be right, or rich. Your choice. This is the way. HDDs ROI??? I do not know 2 months…or the old half 2 years ROFL

I use finite values. I have sold for an average 39 CHF/XCH. Price drops down to 20 CHF/XCH. I buy bottom, once grandma starts to farm Chia with her pacemaker, her cats will farm too. That is the signal.

Why hamster XCH, and wait for the perfect price if you pay the bills right here, right now. And reinvest part of the profit.

It’s 200 W, power draw is measured in Watts, not Watt hours. HDD uses on average 6.5 W, not Wh.

When you talk about Wh or kWh you always have to mention the time span of measurement, like per day or per month, etc.

Let me repeat myself:

Explain to me why a C8 plot would earn 20% less XCH / month ?

And please share your current profit margin with uncompressed plots. How much XCH income is left after paying power bill?

If you keep ignoring my questions you are trolling.

I have added an explanation for this misunderstanding in original posts.

Of course, you are right. It was poorly written in the beginning because it was simplified for energy costs calculations.

Rig uses 200W right here, right now. So it uses in one hour 200Wh…and in one day, it uses 200 Wh * 24h or 4.8kWh (for billing purposes because you are charged for kWh. I do not know where you live, but that is how we are charged in Europe)…*30 and you have kWh per month.

Of course, it is confusing. I didn’t come up with this energy bills crap :smiley: I just make it simple.

Answers for your questions are already written in the original post. All you need to do is read, instead of fiercely defend imaginations. You have rewards per plot, and also wattage per plot…either official plots, and also yours.

Math is simple rewards per month/number of plots. Also there is warning, there is +/-10% after 16 hours, I see reward estimate is already 10% higher.