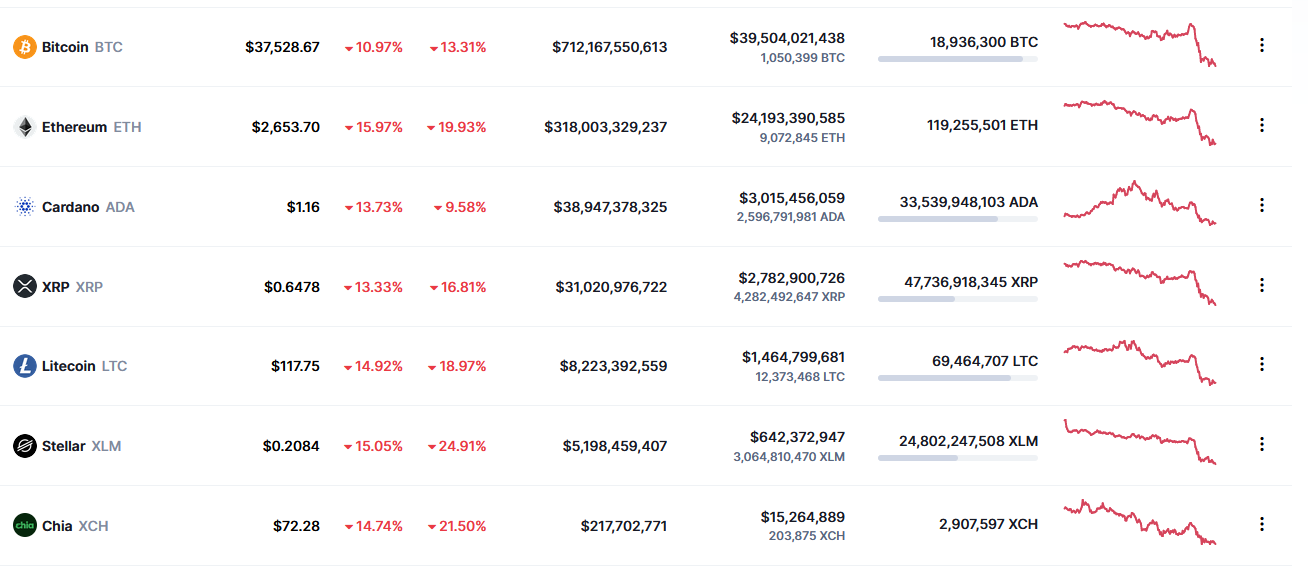
Except they DON’T where it matters most: BTC broke down from its channel and keeps failing to recover. Today it made another attempt and failed again. XCH never never broke down from its channel, although it has continued to test its lows.
It’s an important difference, right there on your chart. But it’s clearer to see on a daily candlestick chart of actual price going back a month or longer. Yours is a percentage change chart.
Edit: Admittedly, today’s drop may very well be the last stance before XCH breaks down too. But even if it does, BTC is still much weaker.
Pearson coefficient is fun with numbers, but doesn’t see the most important – or most useful – aspects of a given correlation. In this case it missed the most important signal on the chart, the breakdown in BTC earlier this month.
Another example is the oil/stock correlation: When you compare charts of CL (oil) and ES (S&P500) they look only somewhat correlated (medium-low pearson coef) yet you could make money in ES almost blindfolded every day just by looking at what CL did overnight and the first hour of the morning session. But you have to look for reversals in oil, sit out the opening rush in stocks, and wait for the reversal once the retail crowd gets the memo. Looking at percentage changes or comparing their charts won’t do it.
I just mention this as an example. Don’t go home and trade it just like that
Edit: I should add this: Of course there is a broad correlation between BTC and XCH, just as there is a broad correlation between cryptos and stocks in general. And you are absolutely right that it will be hard for XCH to break out unless BTC can find a bottom and start rallying again.
I mean this guy just learned about Pearson, it’s not like he’s educated in statistics, give him a break… Next up he’ll probably tell us that a p of .95 isn’t enough, because “maths”
You are back again? You ran crying the first time… back so I can prove you wrong again? What are you going to claim next? Let me guess, Bitcoin follows Chia? Go somewhere else clown.
There are many factors at play here, the virus, the rate hikes coming, the fed, the fed squeeze (yes it is a thing), inflation vs. stagnation…it is a total cluster in every market. Nasdaq is now down close to 13%, that’s a correction. Now we see if Monday brings any relief bounce as many very good companies are getting clobbered for no reason, just being in the wrong sector you can be down 40-60%. Look at Cathy Woods ARK fund. Bloodbath. So, it is not just crypto. Oil has also ripped from $60 to $84. If we do not get a relief bounce on Monday, I believe we are in for some more pain and this data is being driven from the 200 MVA. However, I believe we have some incredible opportunities to snap up. Better than the first Covid crash. Do your DD and be safe. Again, all of this is IMHO.
If you ask me, trend is the least interesting chart feature. What is far more important is being able to predict when a trend comes to an end. Or spot signs that it may have happened. That infamous “bend at the end”.
I just came home and saw that XCH finally did break down, and hard too. I haven’t analyzed the tape or the order books yet, but unfortunately I can no longer say that XCH manages to hold up and stay in its channel while BTC breaks down. Today they all broke down: Cryptos, stocks, commodities – except Nat Gas. Of course bonds are rallying too.
As for XCH, it makes predictions harder that we are now at levels we have never traded before. There are some tools we can use (measured moves, Fibs etc) but they are generally low probability.
I agree. It had to come sooner or later. Lots of new investors/traders in stocks have never known anything but a bull market, and gotten used to “buy the dip, any dip” being a guaranteed strategy. That’s not a healthy market for sure.
It’s definitely real. Whether it is still increasing, we’ll know in a few weeks. Since everybody is talking about it, it could well have peaked already in December.
Netspace has barely budged from its highs (still at 32-33EiB) during the time that XCH price has collapsed.
I don’t have an easy way to put them both on the same chart. I would say open two Chia Explorer windows, showing XCH price and netspace for the same time period, then place one above the other.
The amount of XCH supply is constant, independent of the number or size of farmers. Until the next halving it is 64 XCH per 10 mins (if I remember correctly). So unless the remaining farmers hodl more than the ones that leave, it shouldn’t affect XCH price.
But of course it will be more profitable for everybody else in XCH terms
Another important facor here is the running cost to produce 1 XCH.
With 4-5 TB disks, it is about $20 for 1 XCH. Of cource it depends on disks power consumption and electricity price and actual difficulty.
So my prediction is that Chia will hit a bottom of 20usd, before going up.
We have seen the same with BTC price and ASIC miners few years ago.