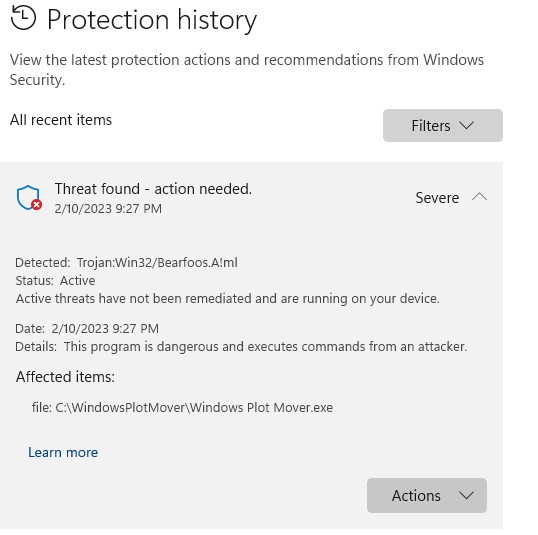
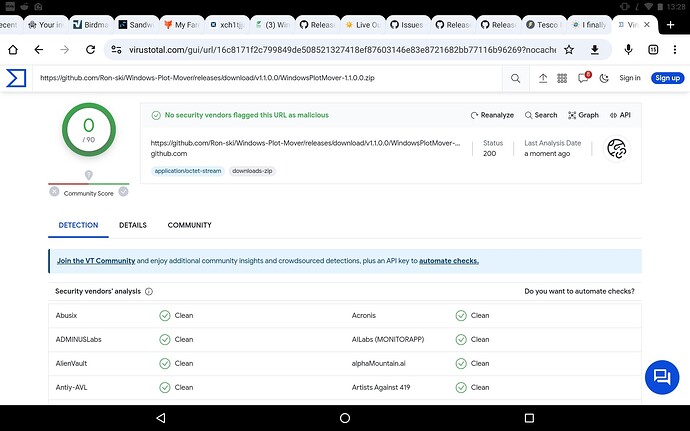
Warning
Please review the code to make sure you are happy with what’s its doing (the code is available on my Github account), and please use a cold wallet - running programs, especially an EXE where you can’t see what’s its doing is dangerous, and whilst I’m not doing anything dodgy (but I’m just someone on the net so you shouldn’t trust me) it doesn’t mean someone else’s code isn’t. You should ALWAYS take precautions to protect your XCH, this has already happened!
The program and source code is listed on Github, anyone can download the code, and build it themselves, this also means anybody can alter it and post the program online. PLEASE ONLY DOWNLOAD from my Github account, unless you trust other sources.
About me
I’m not a programmer, I’ve done the odd bit over the years, starting with BASIC on the ZX Spectrum back in the early eighties, then a bit of machine code on the Spectrum, and sometime around 2012 I co-wrote a program which was used by many people for logging VDSL modem stats. So the code may not be efficient, and there may well be odd bugs, or events not handle cleanly, but it worked for me.
I’ve never used Github before, but wanted to make the code public, so have uploaded it there.
Download.
and code repositories, so people can check and build from source.
Description
This program is designed to run on Windows, it is written in Visual Studio 2022 VB Net, depending on your system you may need to update Dot Net.
I wrote this for my own use, but I can see that others with Windows systems struggle moving plots, so have decided to make it publicly available via Github. There are other systems available, but they tend to be complicated scripts, mainly for Linux.
Performance
How it performs is entirely dependant on you’re hardware. There will always be a bottle neck somewhere, drive read speeds, drive write speeds, network speeds etc. If using a network please be aware of the limitations of 1GbE which will only manage one move at a time, I use 10 GbE and have easily moved 6 plots at the same time.
Installation
There is no installation required, simply download the zip file, and extract the two programs. Double click “Windows Plot Mover” to get started, the other program is run automatically from the plot mover GUI.
Usage
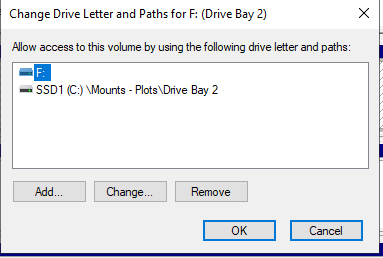
The program uses drive letters as its much easier on the programming, if you have mounted drives just add a drive letter from disk management (they can stay mounted as well), you can remove the drive letter once you’ve finished with that drive. If you’re drives are on another machine then you need to map them to a drive letter.
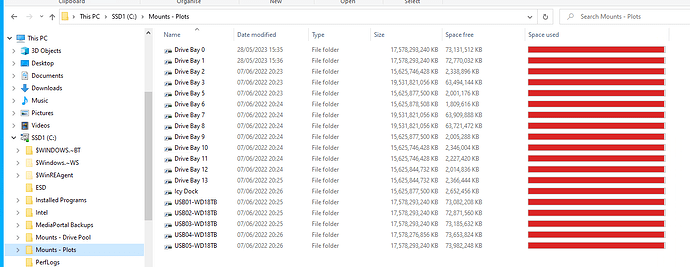
I have recursive plot scanning turned on in the Chia GUI (Settings/harvester), its much easier, the majority of my drives are mounted in folders, so I just need to add the root mount folder to Chia and it then automatically picks up all plots in the sub folders.
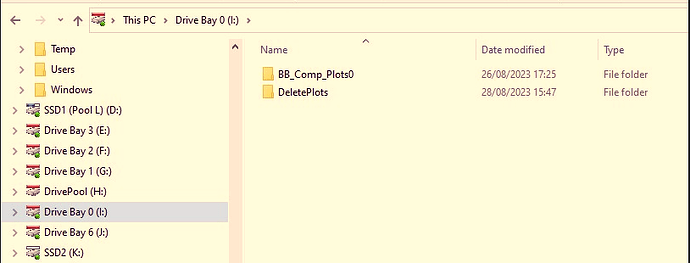
On each drive I have a folder with the existing plots, I rename that to something like DeletePlots (it can be anything), then create another folder for the new plots, I normally name this so I know the drive.
Here it is mounted
Here it is with a drive letter assigned.
Repeat the above for all the drives you want to use.
Adding drives/destinations to the program.
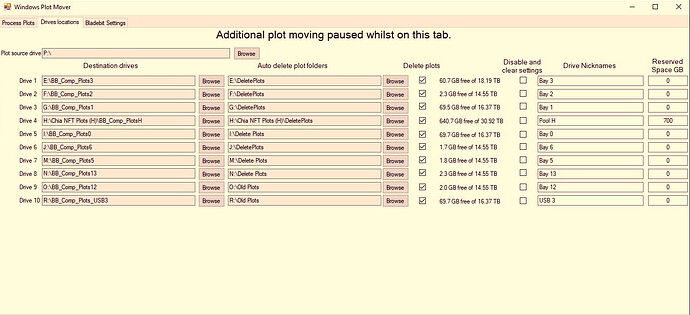
On the drive locations tab, select the plot source drive first by clicking the browse button.
Then you can add the destination drives, by clicking their browse button. If you are deleting plots, add the delete plots folder, and tick the “Delete Plots” check box next to it.
“Disable and clear settings” will clear that lines settings, and disable it.
If you want to enter a nickname for the drive then enter that in the nickname box, I would use a reference name that refers to that specific disk.
Reserved space is used if you don’t want to completely fill a drive - I have a drive which is used for data and TV recordings, so I keep 700GB free.
So once you’ve added drives you will have something like this.
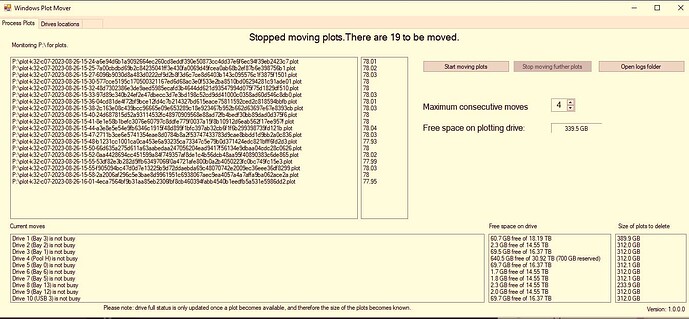
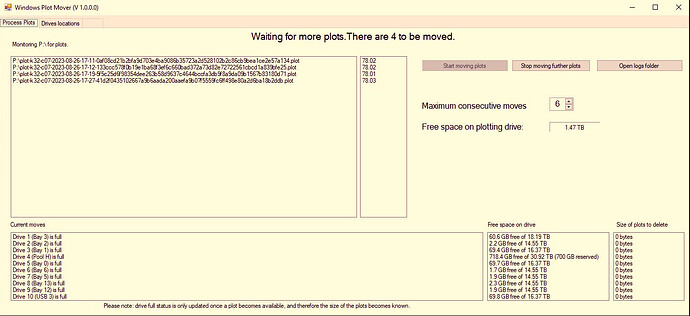
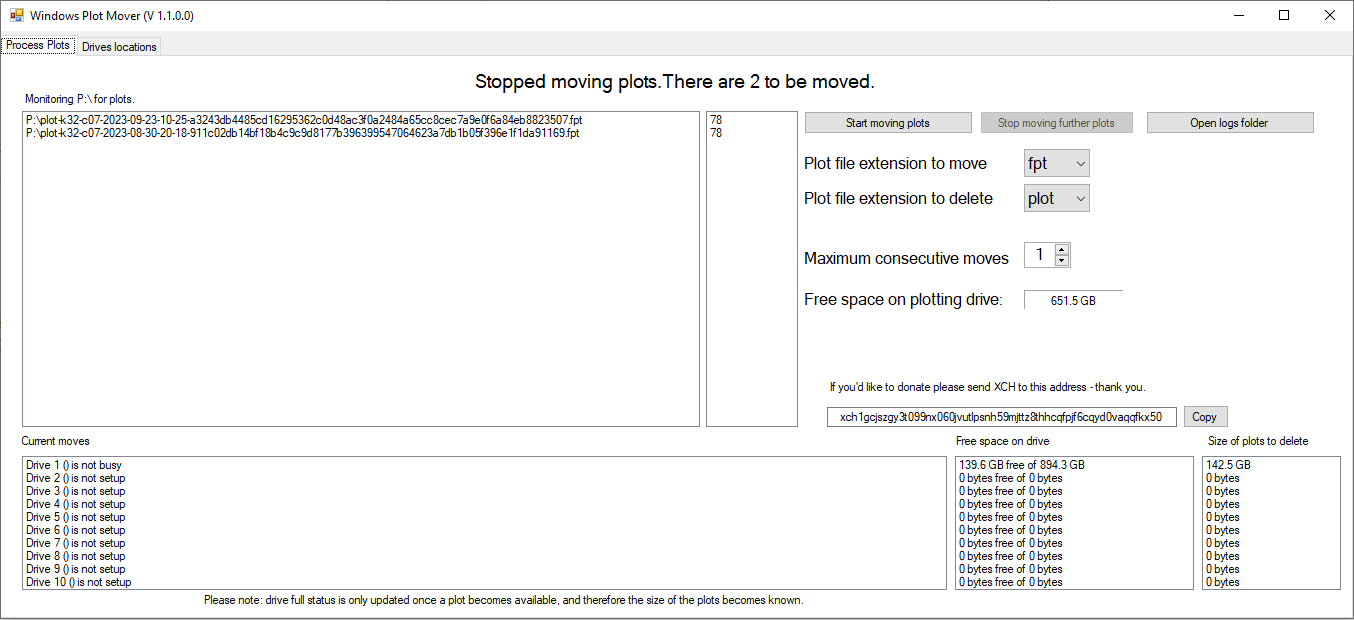
Now switch back to the Process Plots tab, so you have this, if there are plots on the source drive they will show up in the list at the top left.
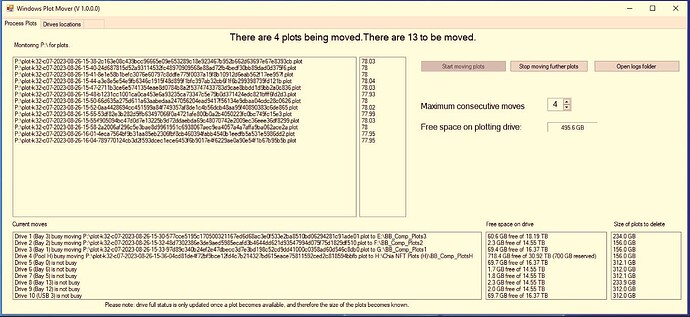
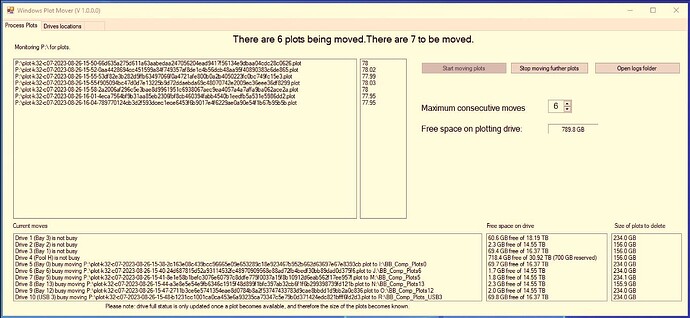
You’ll need to change “Maximum consecutive moves” to suite your hardware (I suggest starting at one and increase it as you get a feel for it), then press start. The more plots you are moving, and the more drives you are writing to will affect Chia’s response time, so monitor that as well.
As each move completes it will cycle through the drives, deleting plots to make space if required, and moving plots.
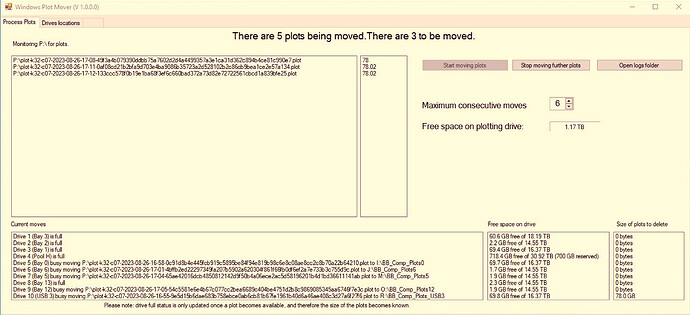
Here are some drives now shown as full, when a drive is full you can switch to the destinations tab and select another drive to replace the full one.
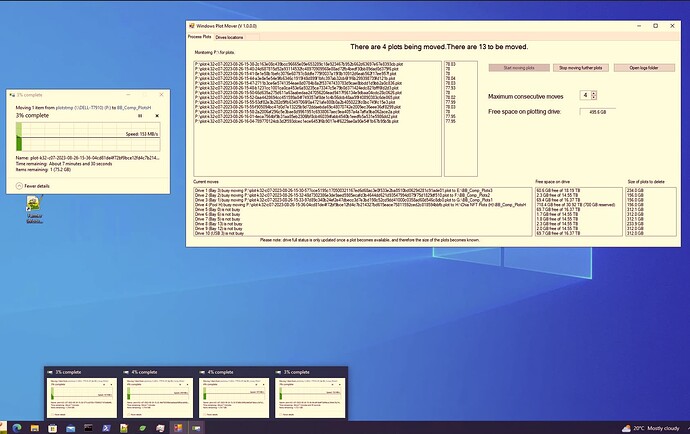
When moves are started the standard Windows move dialogue comes up, but I couldn’t work out how to get them to open in different locations on the screen, so they all appear on top of each other, you can hover over the task bar icon or manually spread them out.
Eventually all the drives will be full, and I’ve just noticed an error in the message at the top - its not waiting for more plots, the drives are all full!
Currently the Chia Bladebit plotter will crash if the destination drive becomes full, I believe this will be fixed in the next release.
All moves are written to logs in the log folder, the last two numbers are the size, and the time it took to move.
Plots are renamed whilst being moved, and then renamed once complete. This is a screenshot from my Linux plotter, the files being moved are name .movXX, where XX is the drive number they are bing moved to.
